
Assessing Gasoline's Deflationary Impact on Upcoming CPI Data

Eric Pachman
Published
August 26th 2024
Eric Pachman
Published
August 26th 2024
Now that the Fed has signaled that rate cuts are imminent all eyes will likely turn to how quickly the economic data will slow. Sadly, the data doesn’t offer us any hints on what’s going to happen with the next nonfarm payroll data release, so we’ll wait for the data to drop on 9/6 to assess the situation.
Well, that’s not exactly true. There is one interesting data signal that we found rummaging through the BLS’ labor data. And that’s the historically large disconnect between the Establishment survey data (i.e., nonfarm payrolls) and the Household survey data (i.e., labor force / unemployment). We shared this finding with the social media community last week, so rather than rehash it here, we’ll just embed the post below. We’re not quite sure what to make of this, besides promising ourselves not to be surprised if the nonfarm payroll data ends up getting revised down far more than it was last week.
Please wait...
The data is offering clues on where August 2024 CPI is headed
But labor is not the point of this post. This post is about inflation – specifically, providing a clue on what could happen with the next CPI print (August 2024) which is due out on 9/11.
This clue comes from the price of gasoline at the pump.
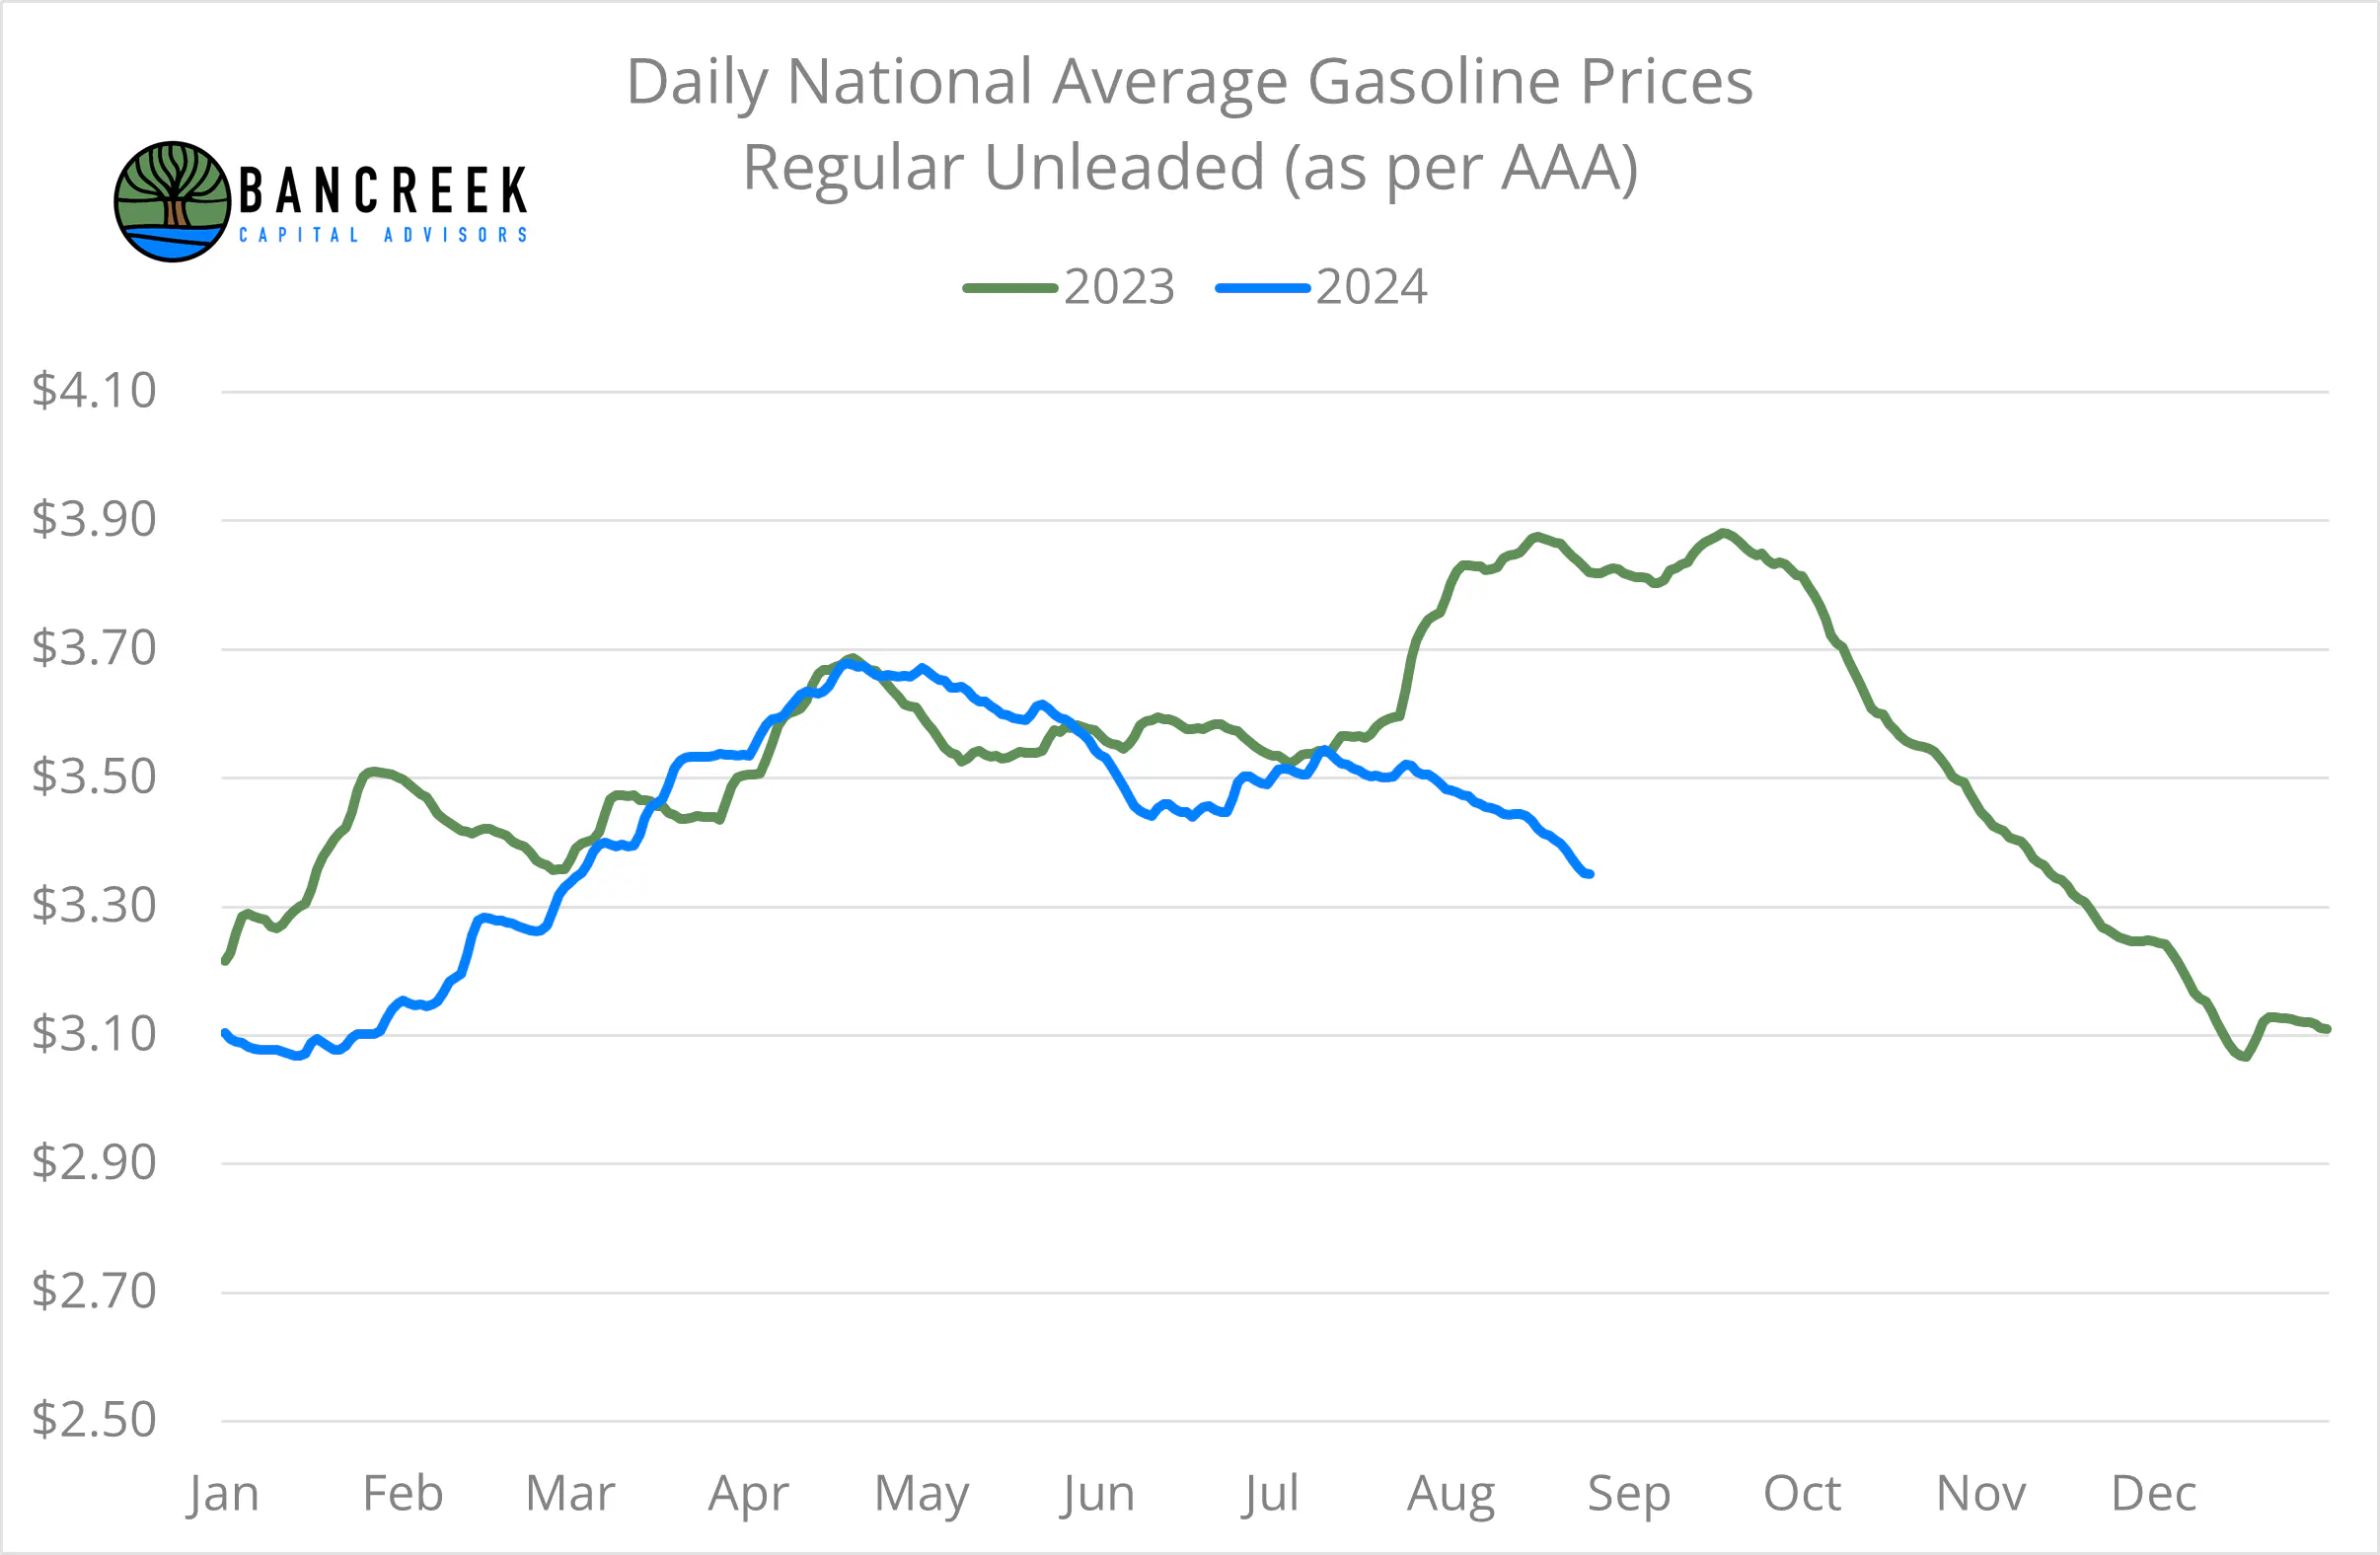
If you drive around much, you may have noticed that gasoline prices have been relatively stable as of late. If we look back to March of this year, the Daily National Average Gasoline Prices (as per AAA) have bounced around in a relatively tight range between $3.34 per gallon and $3.68 per gallon. This uncharacteristic lack of volatility has allowed us to move our focus elsewhere – namely, housing and auto insurance – when commenting on inflation drivers.
But starting with this next print, we expect that to change in a major way. As shown in the chart below (and as you may recall), exactly one year ago gasoline prices surged to an average of $3.84 in August 2023 and remained there in September 2023, before falling to an average of $3.61 per gallon in October. Compare that August 2023 average to average prices so far this month, which through 8/25 are $3.43 per gallon. That’s a 10.7% year-over-year decline in gasoline prices, at least based on this one data source. That’s the largest year-over-year decline since July 2023, when gasoline prices were down 21% from a blistering $4.53 per gallon in July 2022.
Source: Bloomberg
The $64,000 question is whether the 10%+ drop we see in gasoline prices as reported by AAA will flow through to the gasoline item within CPI.
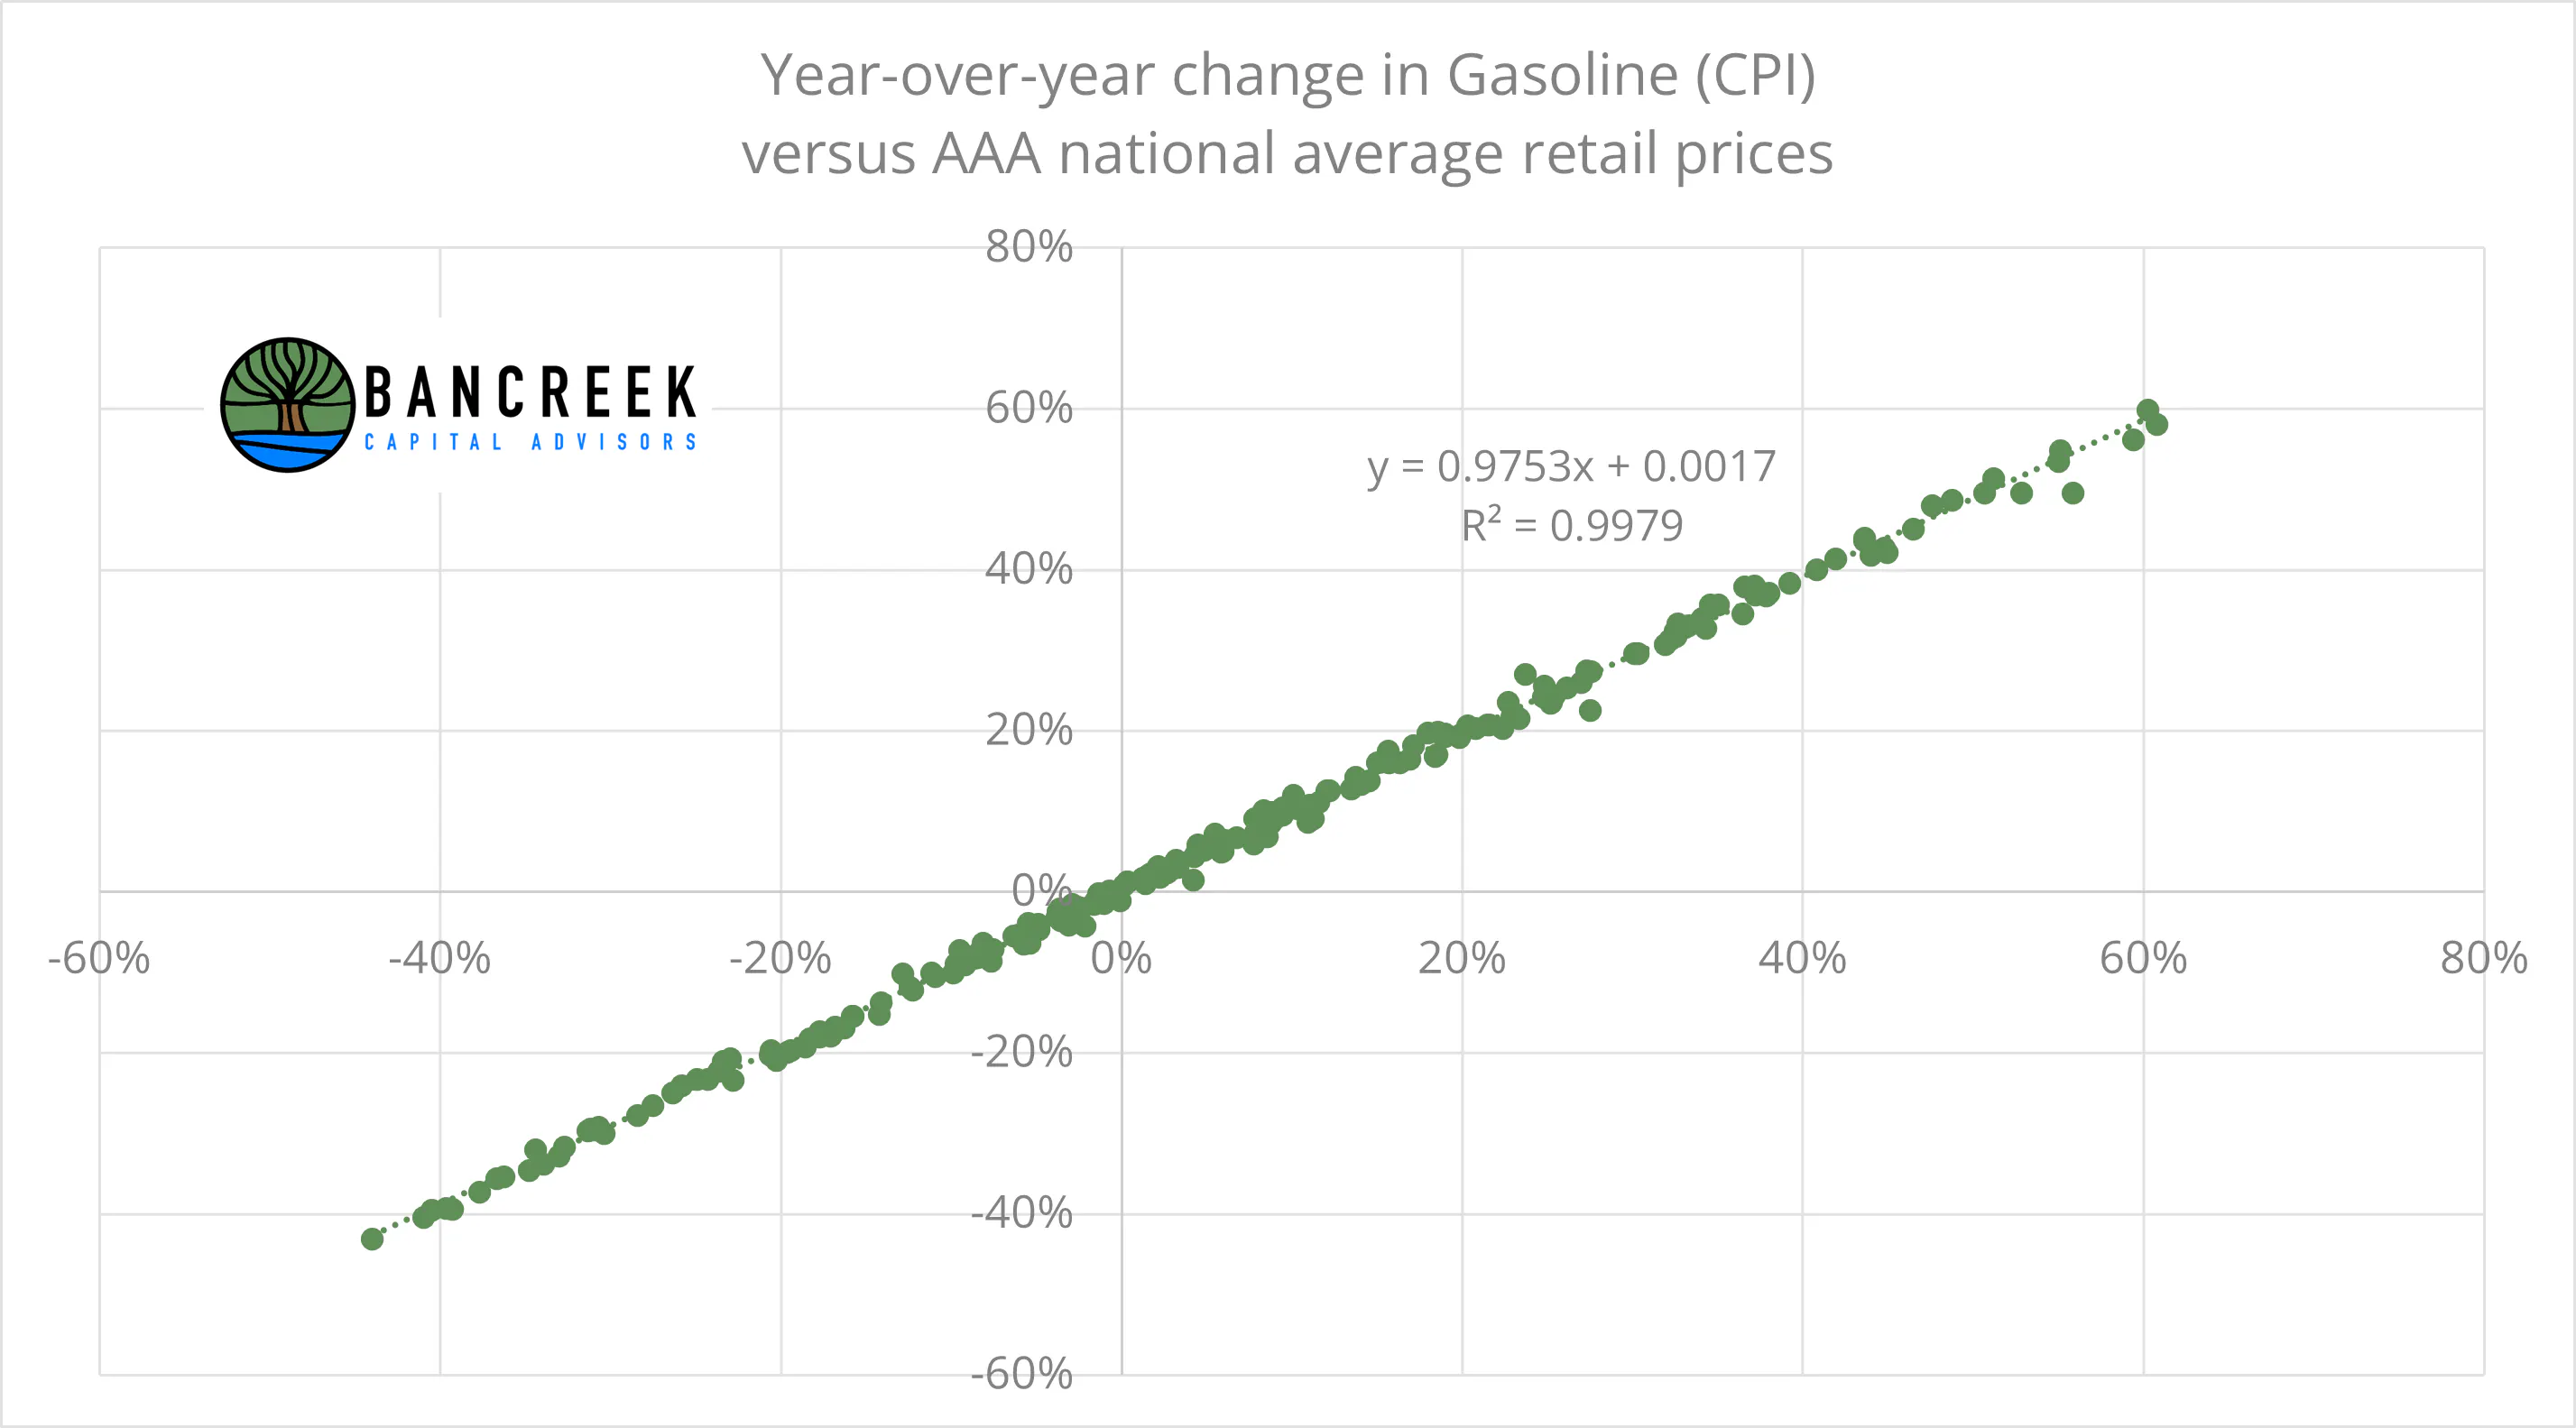
The answer is, at least based on a lot of historical data, it should! The following chart presents a scatter plot with the year-over-year change in gasoline prices as per CPI (y-axis) and AAA (x-axis) for each month going back to March 2005. The correlation is nearly perfect between these two series.
Source: Bloomberg, BLS, Bancreek Capital Advisors
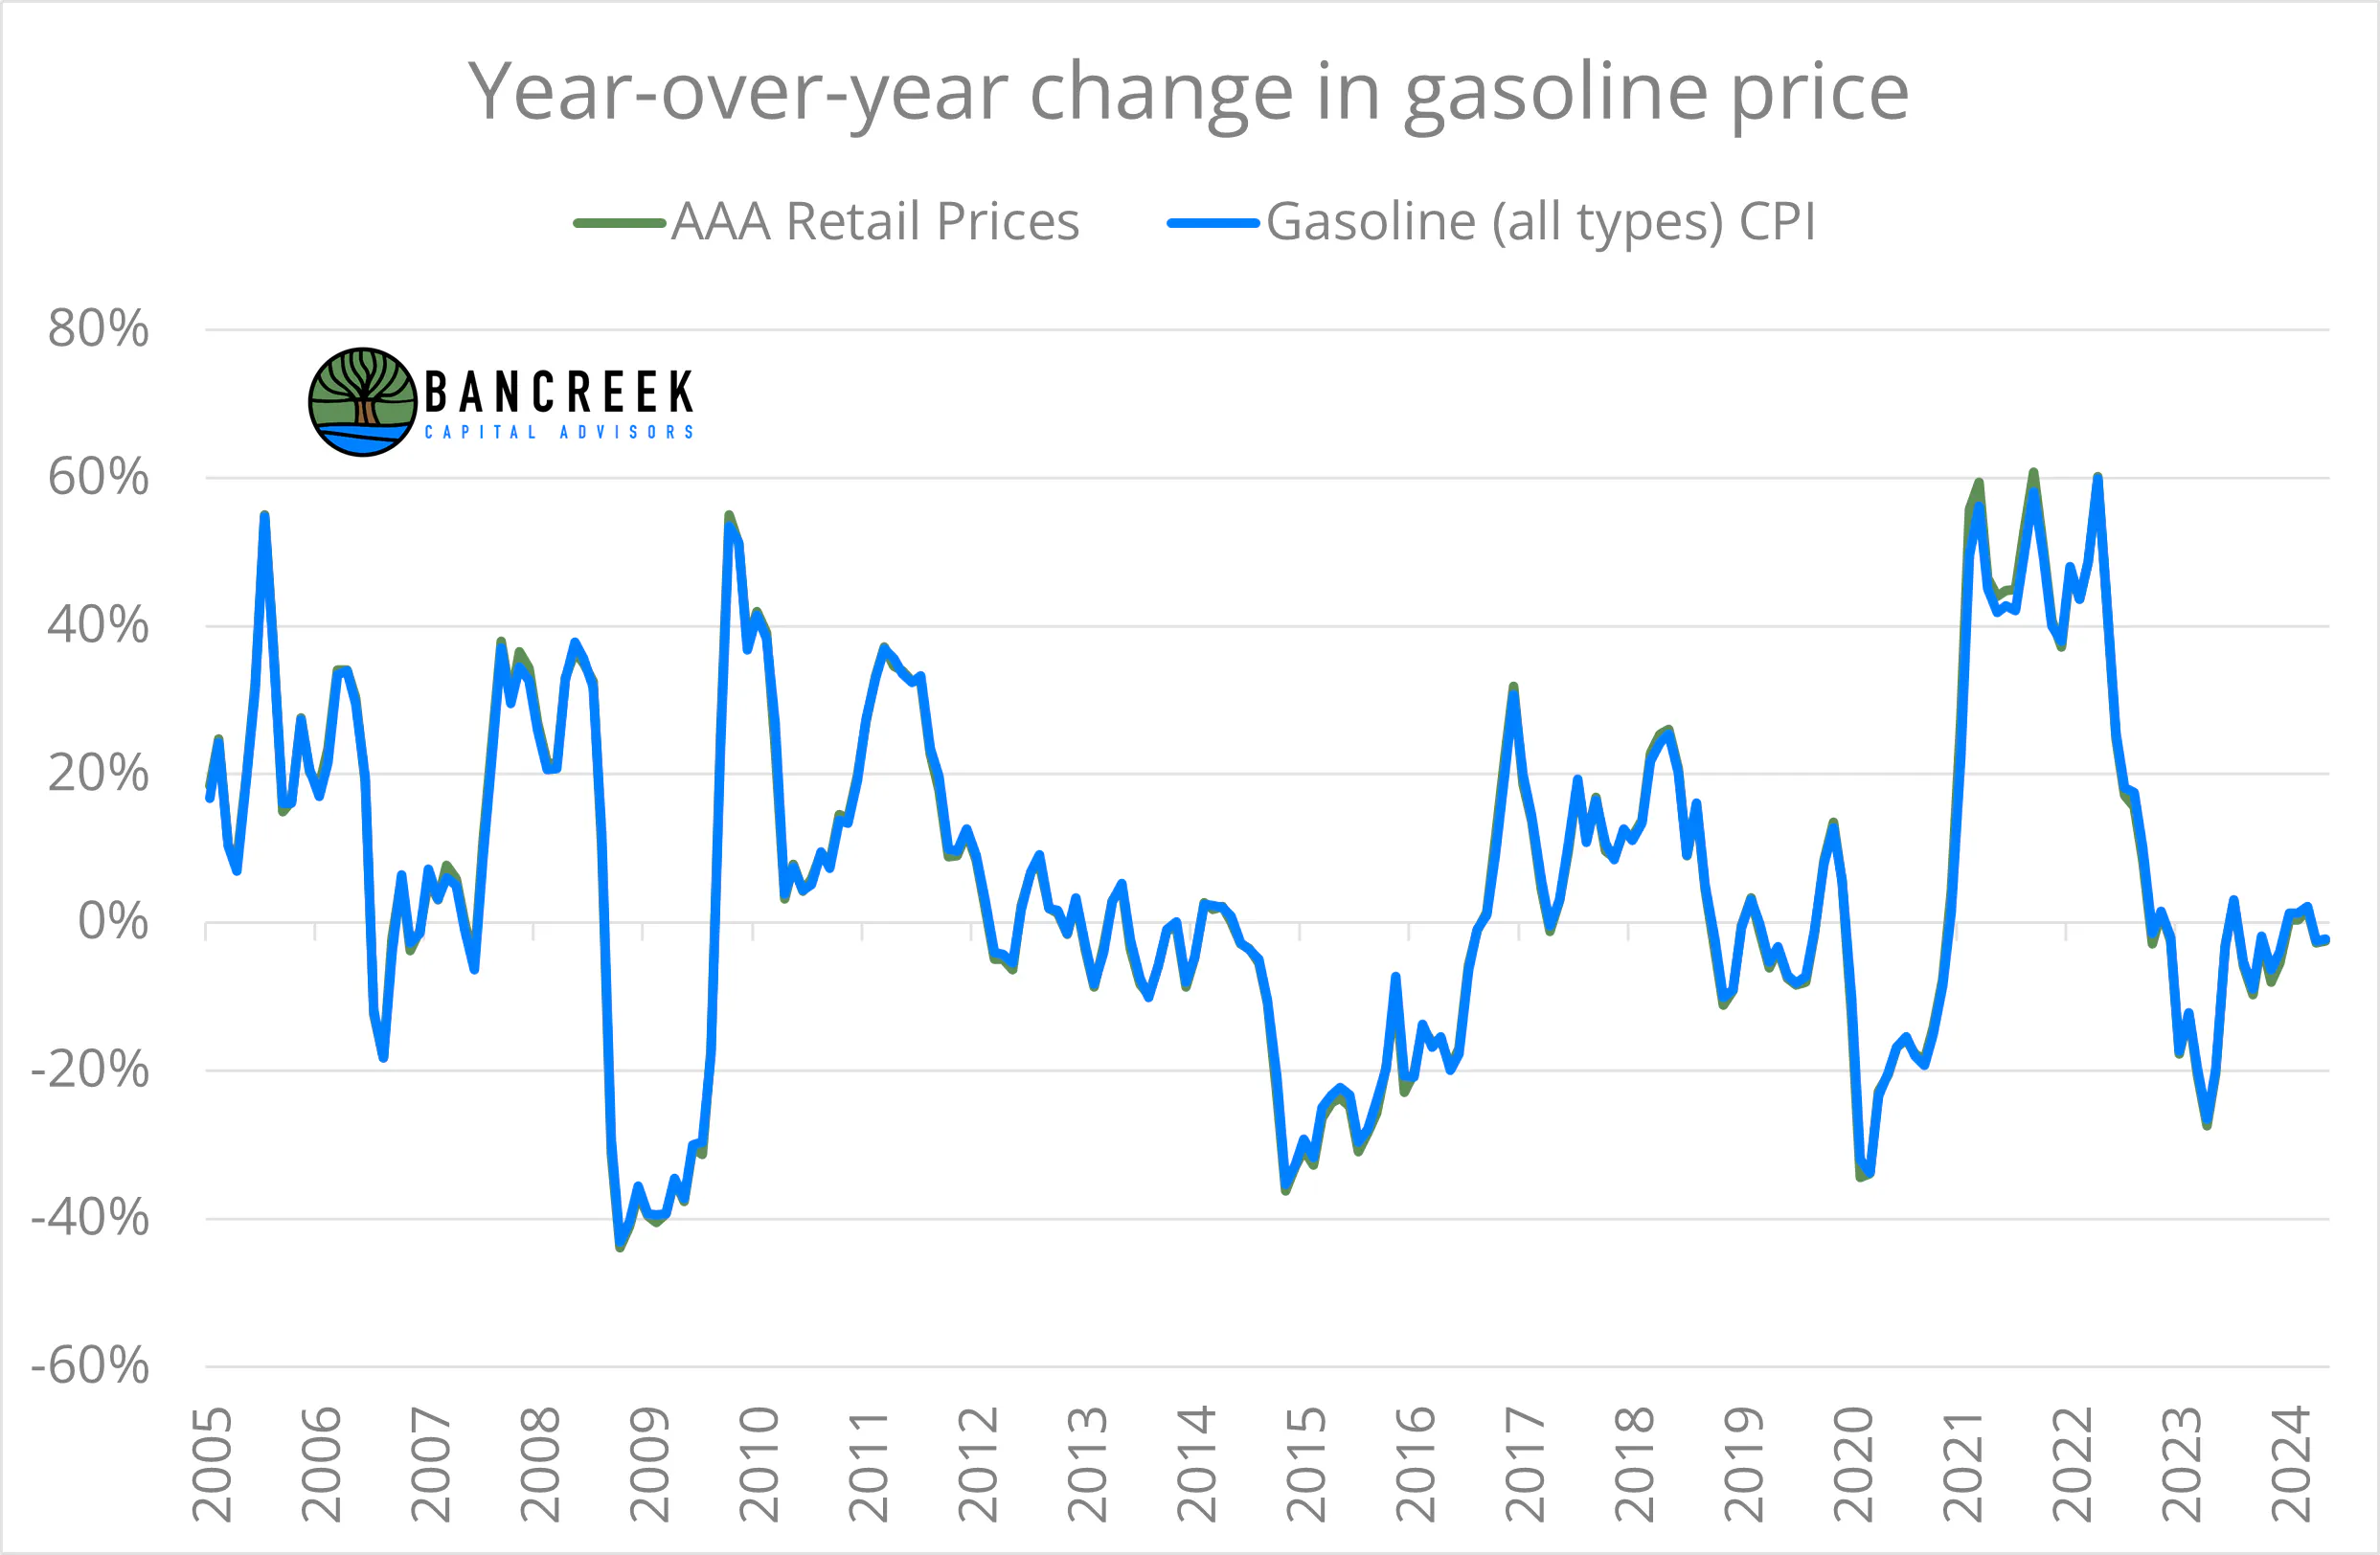
If you are the type that prefers time series charts to scatter plots, this next chart is for you. Don't be fooled - there are actually two series on this chart. They are just so close to identical that they appear as one line.
Source: Bloomberg, BLS, Bancreek Capital Advisors
Sizing the gasoline deflation impact
So, the key takeaway from the last two charts is that we should with very high certainty expect CPI gasoline prices to deflate by around 10% in August when the data is released in a few weeks, providing a nice tailwind to headline CPI in the month.
Let’s keep going and estimate what this tailwind could be! To do so, we need one additional piece of information – gasoline’s weight In CPI (or in BLS parlance, “relative importance”). Consulting our database of historical CPI weights, we expect Gasoline’s weight to be around 3.4% this month. As a reminder, we use prior year weight to size inflation for the current month - so we are using gasoline's August 2023 weight for this modeling exercise.
Knowing this, we can then just multiply our expected year-over-year deflation for gasoline (10.4%) by its weight (3.4%) to estimate gasoline’s inflation impact in the month, which we estimate to be -36 basis points.
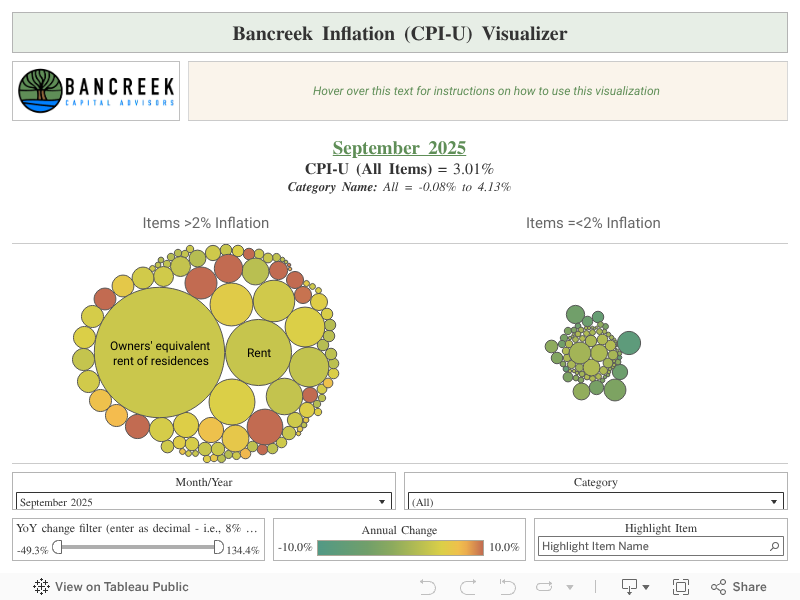
If you take a look at the Bancreek Inflation (CPI) Visualizer, you will see that in July 2024, gasoline’s year-over-year inflation impact was just -8 basis points (hint: to find this item just type "Gasoline" into the "Highlight Item" box). So, it follows that in August, CPI should see another 28 basis points of year-over-year deflation relative to what we experienced In July. If this were the only factor that changed that would put headline CPI at 2.6%.
Gasoline is a gift for the Fed
We imagine the devil’s advocates out there are thinking, “that’s great and all, but gasoline is non-core and what really matters is the core CPI number.” While we don’t disagree with you, consider the following questions:
- When the media reports inflation, which number does it report first? Headline or core?
- Which number is more known by the public?
The point is that perception matters, especially in a scenario where the Fed is looking for evidence to support its stated intention that it will cut at its next meeting. Given how healthy August 2024 CPI could look (thanks to gasoline prices) we expect it to be offered as proof of the success we have had in reining in the inflation boogieman.
To be fair, core inflation (which, let’s be honest, is now largely just shelter) is on its way down as well. We wrote about this at length in our last inflation update. If the month-over-month shelter inflation remains relatively subdued (as it has been in recent months), year-over-year shelter inflation will ease to a more workable level over time. That's just math. But this math is going to take several months to play out. With this as backdrop, gasoline’s deflation in August, and - unless we see a spike in gasoline prices soon - potentially in September as well, is a gift to the Fed, giving them some reassuring headline CPI numbers as they wait for the decline in core shelter inflation to play out.
Enjoying this post?
Tell others about it.

Bancreek's Actively Managed ETFs
If you are interested in learning more about Bancreek Capital Advisors' actively managed ETFs click the link below
Learn MoreMore articles like this
Fetching Related Posts
There are no other articles tagged with Research
