
Key takeaways from the August 2024 Consumer Price Index release

Eric Pachman
Published
September 11th 2024
Eric Pachman
Published
September 11th 2024
August 2024 year-over-year inflation comes in 36 basis points lower than prior month
This morning the Bureau of Labor Statistics released the August 2024 Consumer Price Index for All Urban Consumers (CPI-U). Overall CPI-U was reported at 2.53% year-over-year (YoY) for August, down 36 basis points from 2.89% year-over-year last month.
As a reminder, Bancreek publishes two visualizations that can help you explore CPI-U in granular detail. Both of these visualizations have now been updated through August and are embedded below:
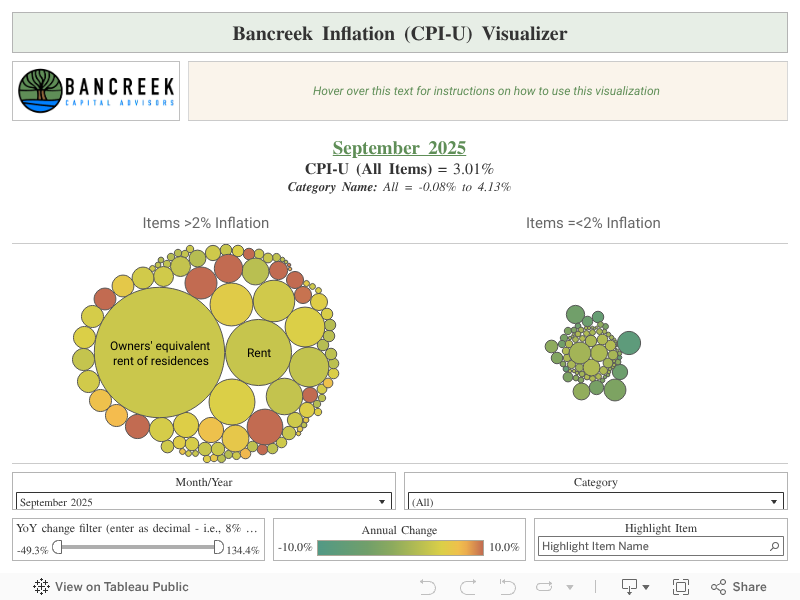
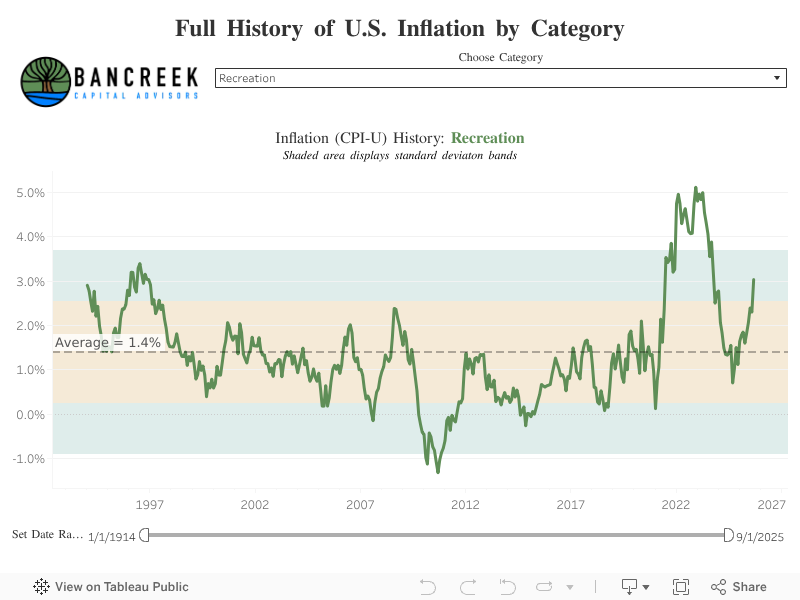
This post hopefully will further assist in your analysis of the moving parts underlying this month’s CPI-U print. Its goal is not to provide a comprehensive analysis of the nearly 180 items we track (that’s what the visualizations are for), but rather just to point to the most meaningful changes from one month to the next.
To perform this analysis, we track a measure we call “inflation impact,” which we calculate by multiplying each item’s YoY inflation by its weight in the prior year period. You can think of this as “weighted inflation” as opposed to the “unweighted inflation” that is more commonly reported by the media. Each month we take the weighted inflation of each item we track in CPI-U and then sum them up to overall CPI-U. Then we compare these weighted inflation numbers from one month to the next to see what drove the sequential increase or decrease. In this way, we can precisely identify the most significant drivers in the change in YoY CPI-U from one month to the next.
Gasoline dominates the numbers, but lots of moving parts underneath falling fuel prices
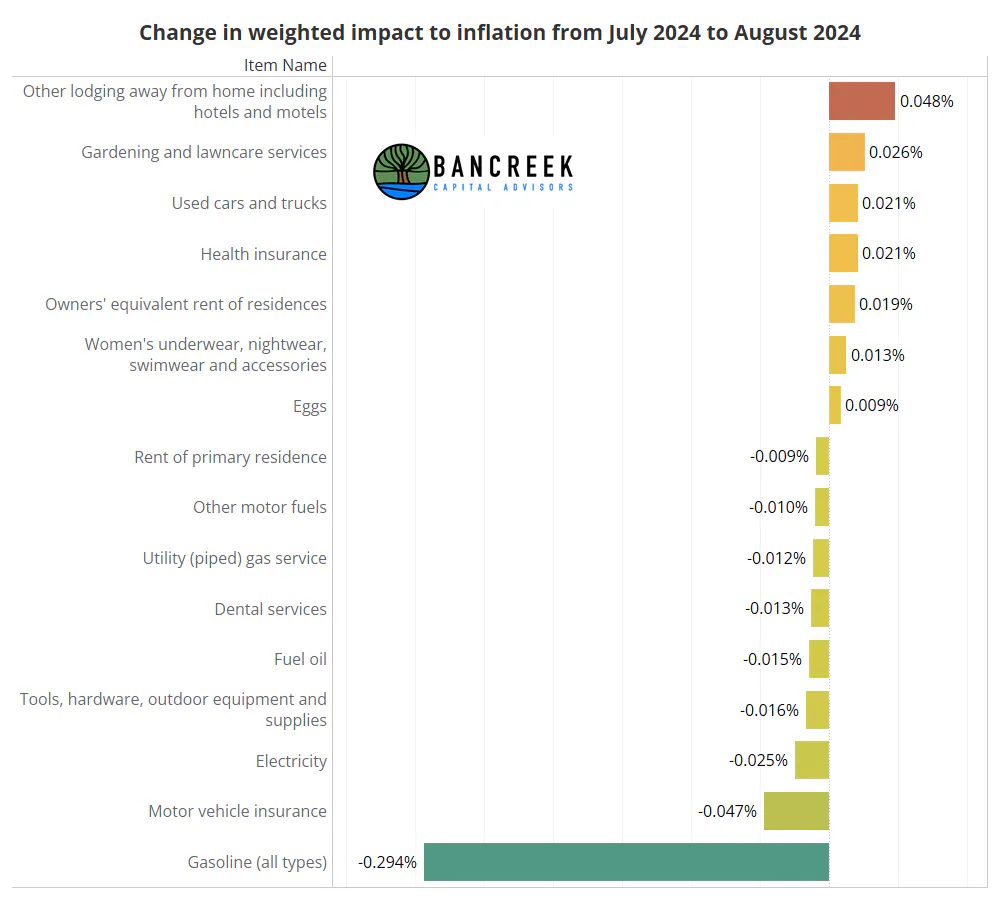
This month gasoline deflation roared back in a major way! But our readers were expecting that already. On August 26th we published a piece that used AAA retail gasoline prices to estimate the impact of the year-over-year decline in gasoline prices on August CPI. In this post, we estimated that gasoline would shave 28 basis points off July's CPI alone.
Well now that we have the data (as shown below), it turns out that gasoline shaved 29 basis points off July's CPI. So, if we have learned anything from this exercise it's that it's possible to predict gasoline's CPI impact with high accuracy.
Source: Bancreek Capital Advisors
"OER plus some other stuff"
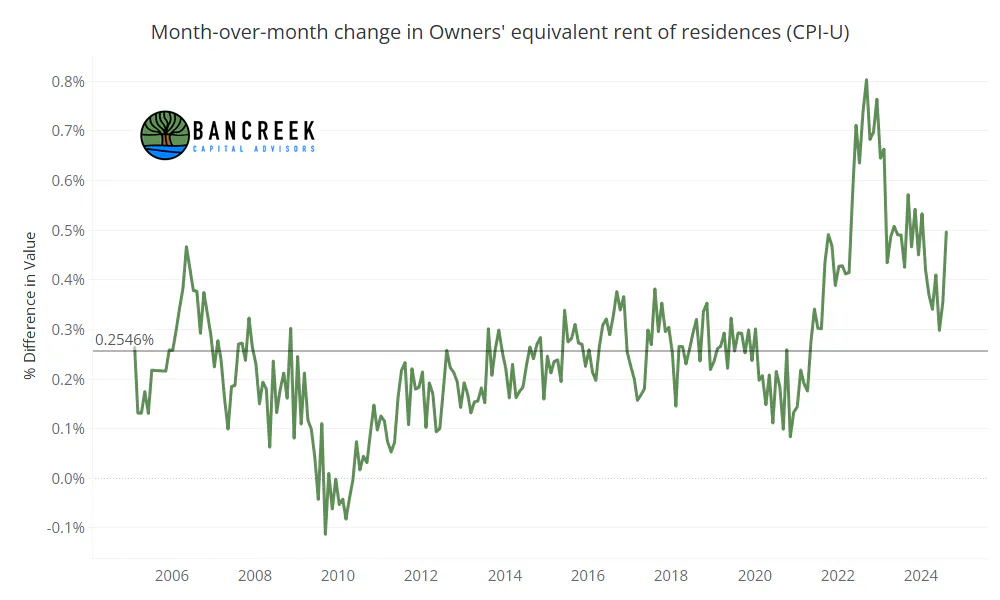
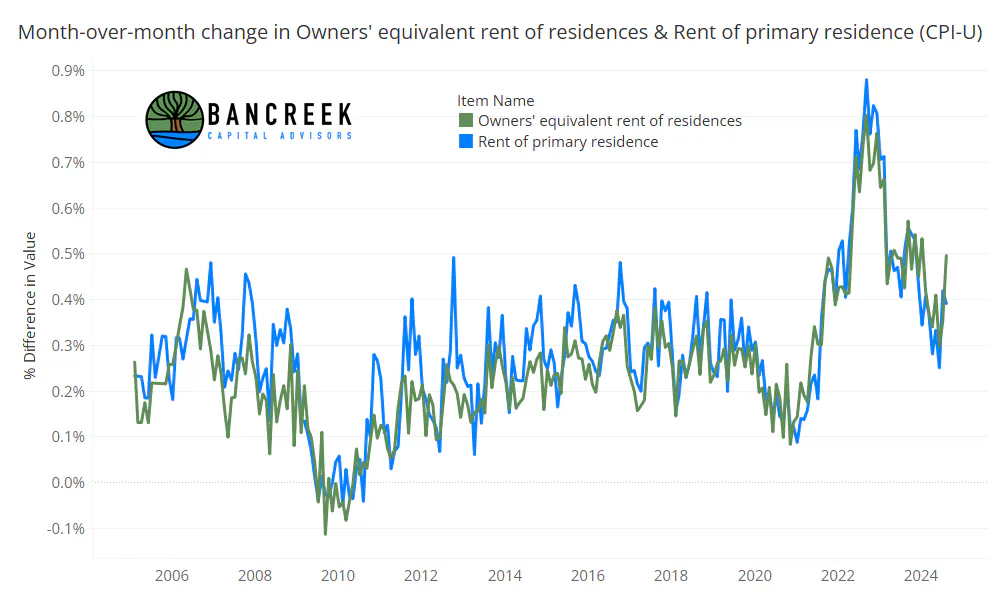
Let's put gasoline aside and move on to the more interesting items. First up (as always) is OER, a.k.a. Owners' equivalent rent of residences... a.k.a., that survey-based rental proxy for homeowners... a.k.a., the thorn in the Fed's side. This month's OER print was very disappointing, clocking in at +50 basis points month-over-month, marking the highest sequential rise since January 2024.
Source: Bancreek Capital Advisors
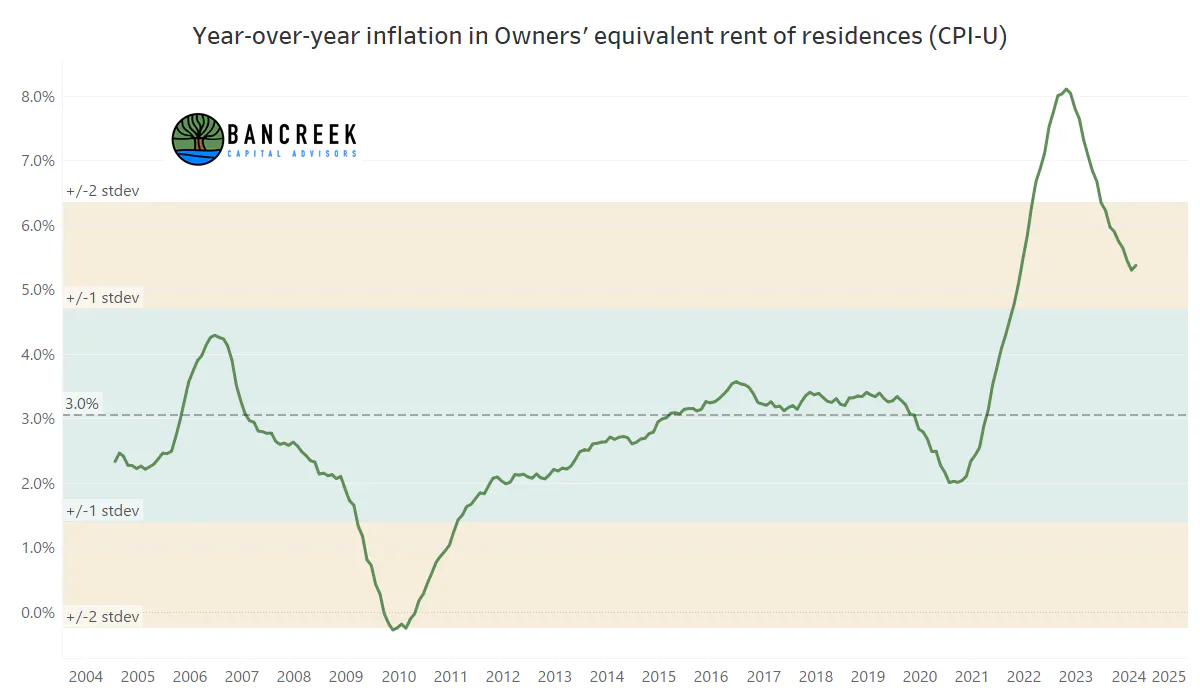
This sequential rise was so significant that it caused the year-over-year OER chart to reverse its gradual decline, rising for the first time since April 2023.
Source: Bancreek Capital Advisors
Interestingly, the spike in sequential OER inflation was not accompanied by a spike in sequential rent inflation. To be sure, as shown below, these two items don't move in lock step. But they usually move in the same direction each month. Not in August!
Source: Bancreek Capital Advisors
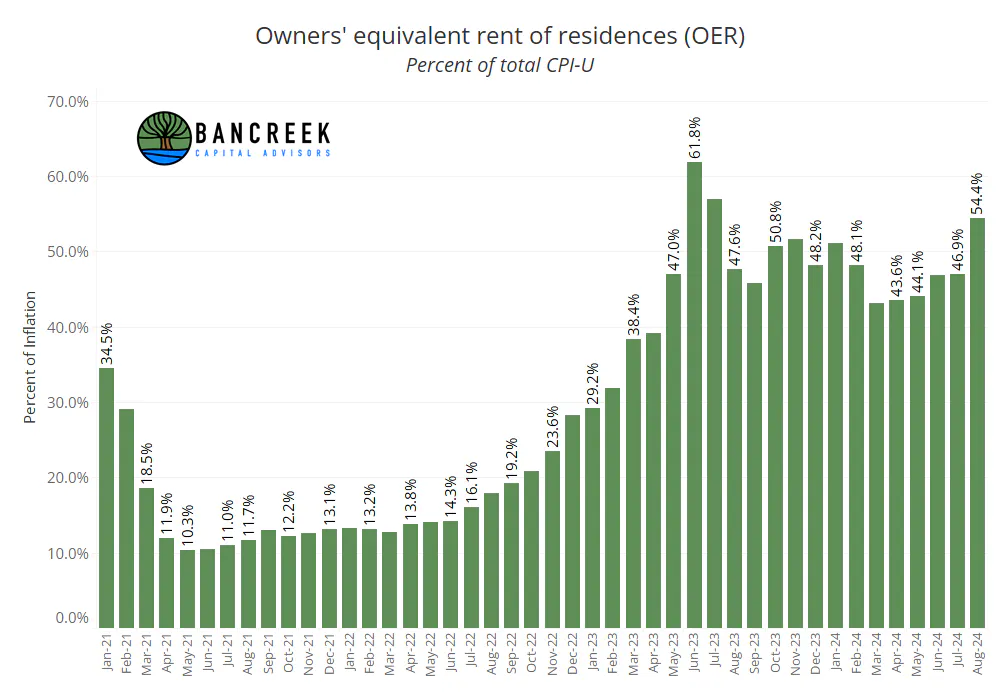
So, carrying a weight that is 26% of all of CPI-U and inflating at a 5.4% clip, OER is this giant thorn in the Fed's side. In fact, as shown below, we calculate that this one item is now responsible for 54% of all inflation.
Source: Bancreek Capital Advisors
Up until this month, the expectation had been that it would ease gradually over time, providing visibility to core inflation dropping to the Fed's target. But today's data has shown that OER is not interested in following any expectations. Rather it's happy to tease the market with a few healthy data points, only to accelerate again to a rate that mathematically makes it nearly impossible for core inflation to fall to the Fed's target. That's why we figure it may be time to just call CPI by its real name: "OER plus some other stuff".
Rounding out the bad news: Eggs and Gardening services
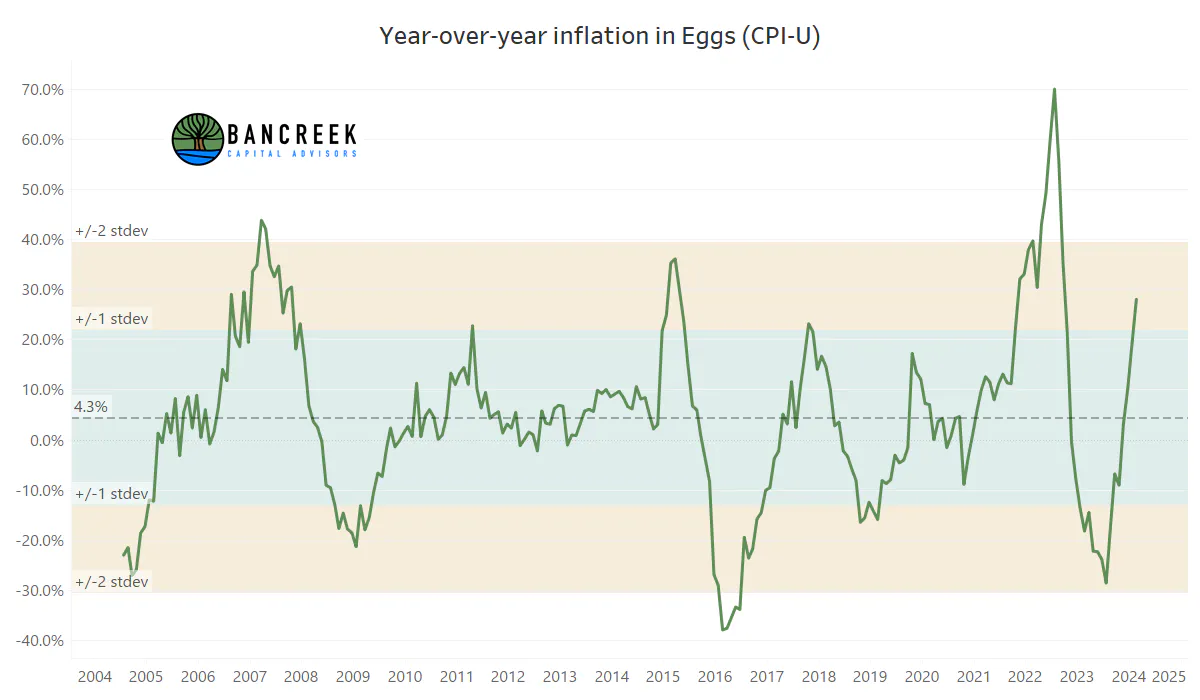
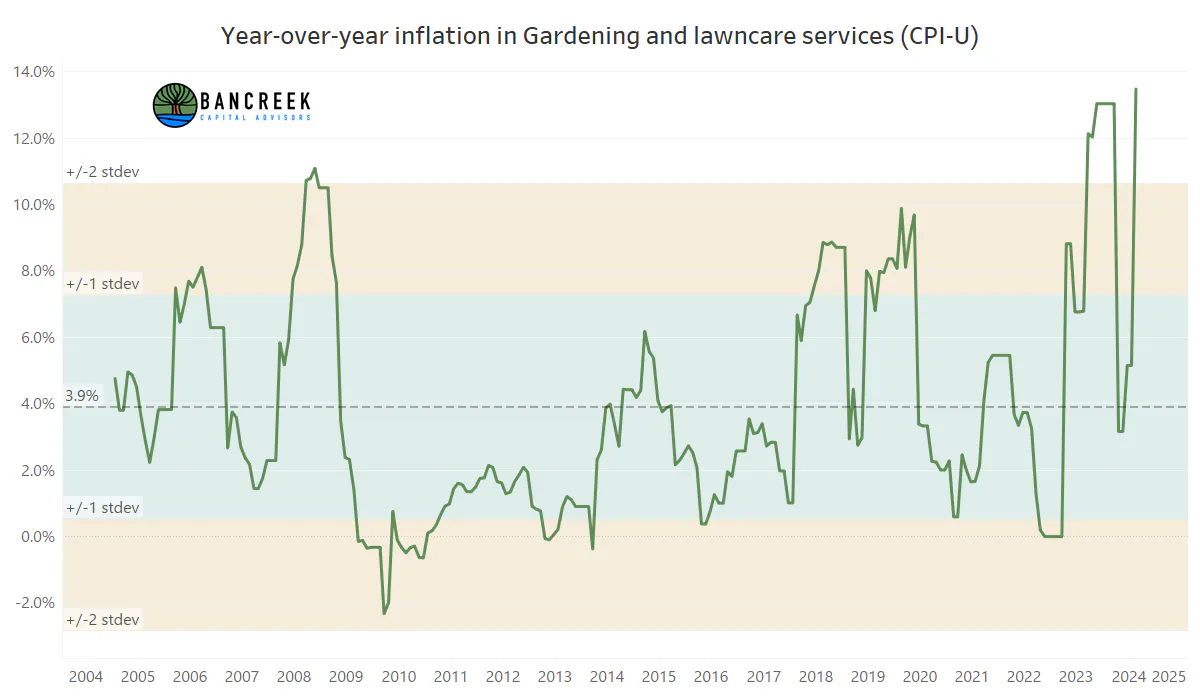
Let's stick with the bad news, because there actually isn't much more in this month's data. The two other items that really stood out to us on the negative side of the ledger were Eggs and Gardening and lawncare services. According to the BLS, egg prices were up a whopping 28.1% while gardening and lawn service prices rose 13.5%. Mind you, the weights of these items are pretty small at 0.11% and 0.31%, respectively. Thanks to these small weights, the two together only were responsible for seven basis points of inflation this month, meaning they barely even deserve a call out. But we figured we would highlight them just to make the point that outside of OER, large inflationary moves in these two tiny items was the only other bad news we could find.
Source: Bancreek Capital Advisors
Source: Bancreek Capital Advisors
Motor vehicle insurance eases
Now onto the good news in today's CPI print. First off, we already mentioned that unlike OER, rents declined sequentially. This is quite helpful as rents carries a 7.6% weight in CPI-U, making it the second largest item in this BLS inflation measure.
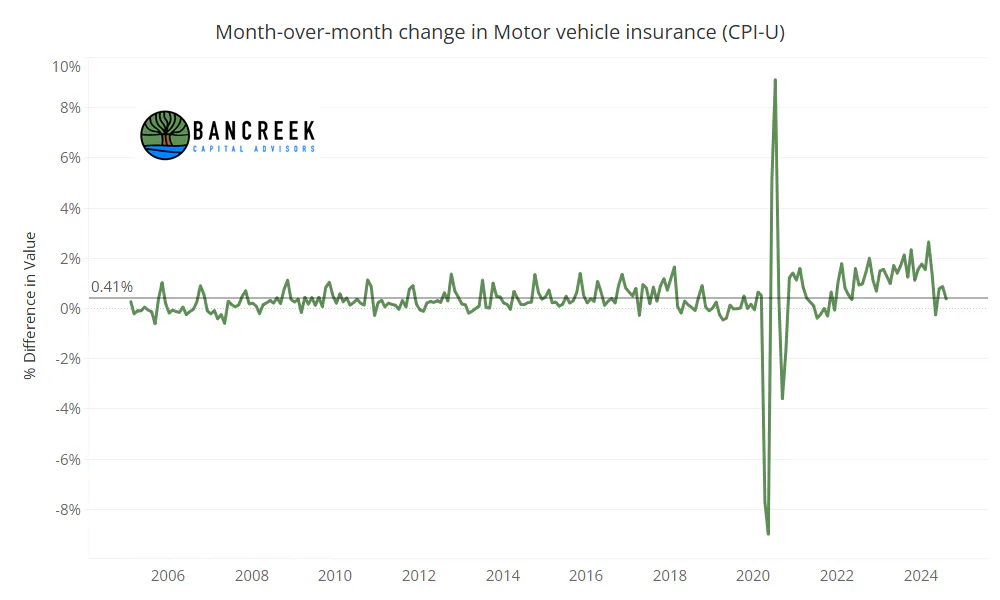
OER and rents are two of what we call the "Big 3" items, with the third being Motor vehicle insurance. You may recall that Motor vehicle insurance has been a serious problem for CPI for many months now as it surged to (and held) year-over-year inflation rates north of 20%. Unlike eggs, this item holds a relatively large weight in CPI too (2.7%) making these 20%+ inflation prints a serious problem for the Fed. That's why it was reassuring to see sequential inflation in this item drop to +39 basis points this month, which as shown below, is in line with its long-term average.
Source: Bancreek Capital Advisors
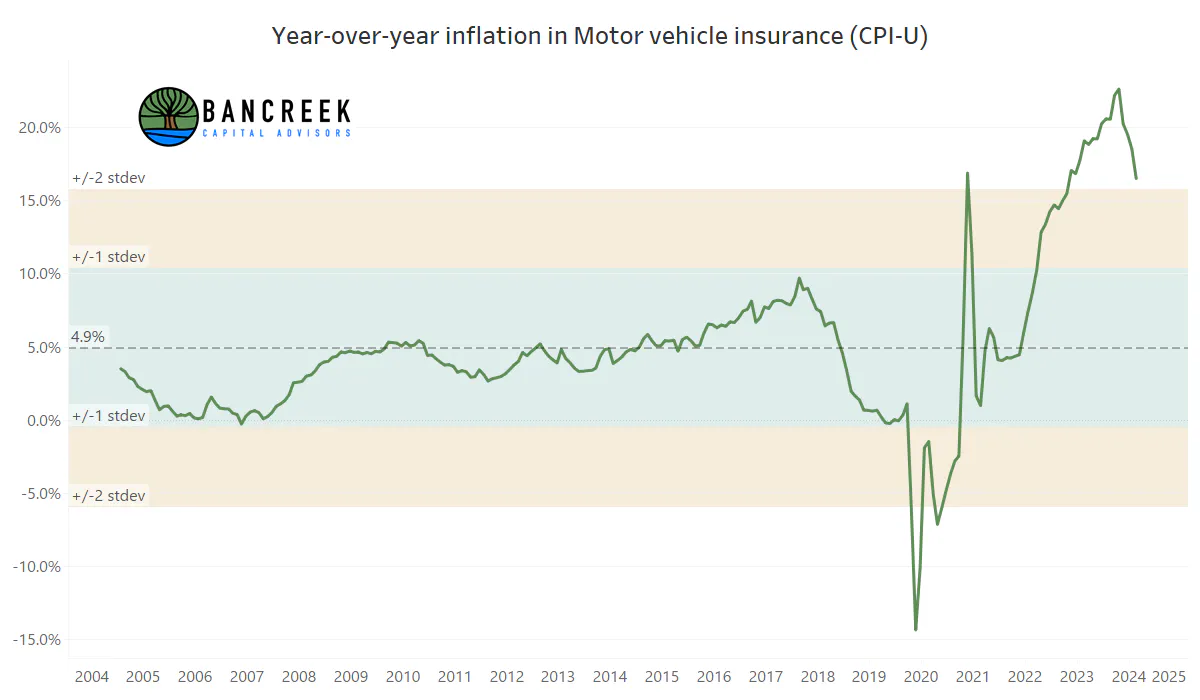
This healthy decline in sequential Motor vehicle insurance inflation helped pull down year-over-year inflation to 16.5% in August from 18.6% last month and 22.6% at it's peak in April 2024. It's really important to note that this favorable move in Motor vehicle insurance more than offset the unfavorable move in OER. So, while OER may steal the headlines and drive sentiment, if we stay focused on the data for these heavy-hitter items, this month's print was actually a net positive for the "Big 3." If you scroll back up to the first chart in this post, you will see that Motor vehicle insurance removed 4.7 basis points of inflation from July to August, while OER added 1.9 basis points of inflation. So, taken together, this is progress.
Source: Bancreek Capital Advisors
Used cars and truck prices continue to decline
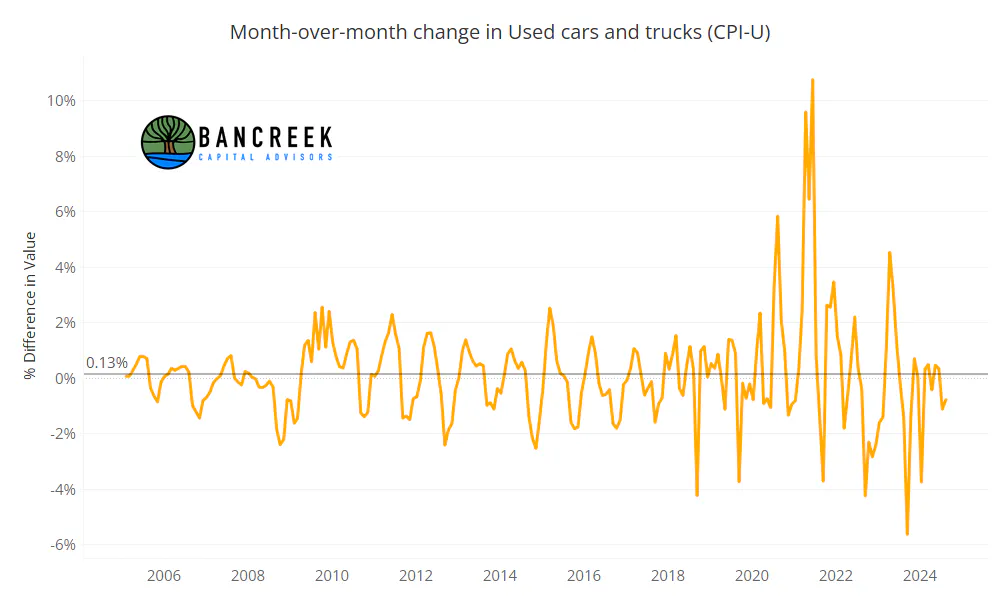
Another highlight of today's release was the continued decline in Used cars and trucks, which as shown in the chart below, stepped down another 77 basis points in August.
Source: Bancreek Capital Advisors
We believe this item is going to be increasingly important to monitor going forward, simply because currently it's reducing inflation by a very meaningful 28 basis points. In order to keep delivering this magnitude of an offset to CPI, it clearly needs to keep declining materially on a sequential basis. It may be too hopeful to expect this item to continue to post the declines it has over the past year, meaning we should brace ourselves for the deflationary impact of this item to wane over time. But this month's continued sequential deflation is welcome news, in our view, suggesting that this item could continue to provide a nice offset to CPI for several months to come.
Inflation (as measured by CPI) = housing
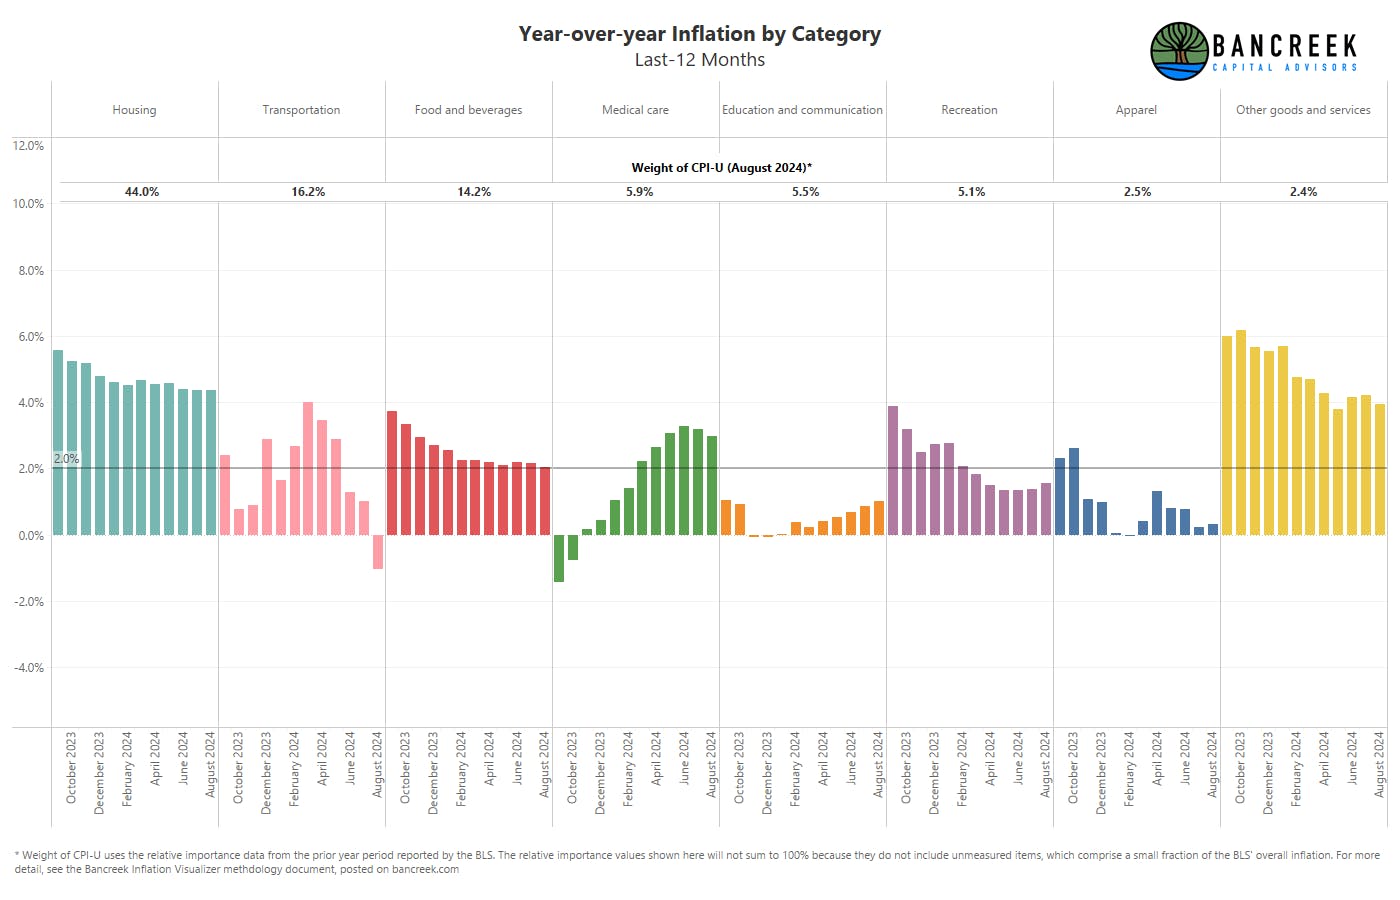
If it wasn't obvious enough what the sticky wicket is for inflation, consider the following chart, which shows inflation by BLS category.
Source: Bancreek Capital Advisors
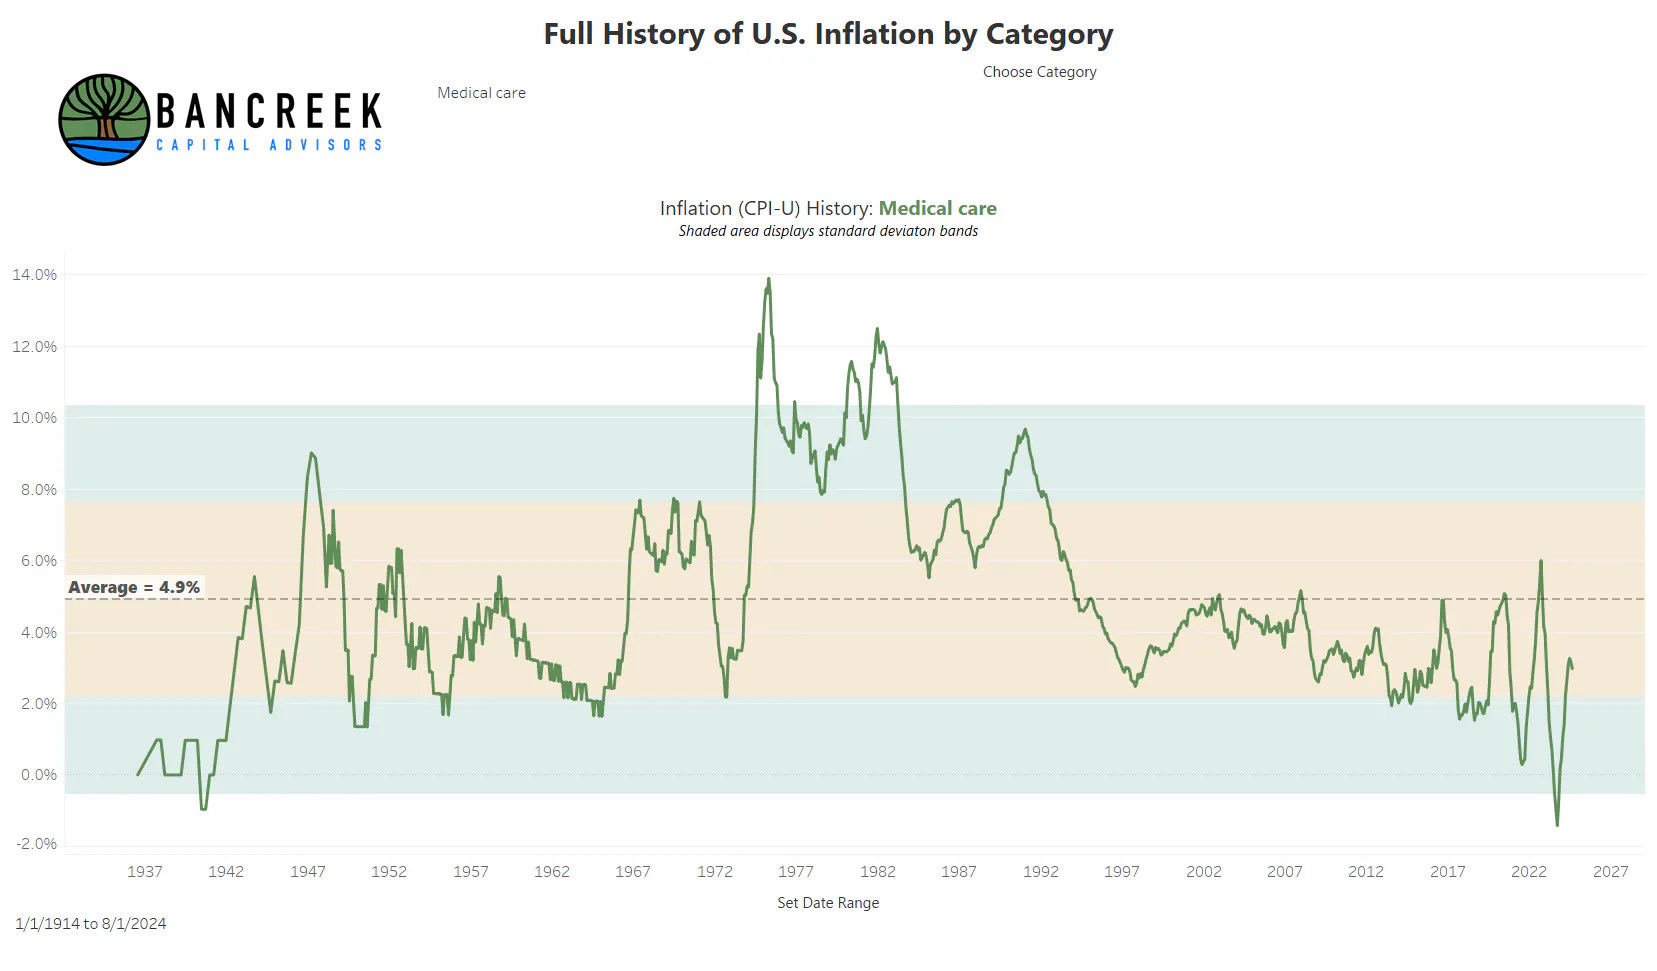
As shown above, housing has stalled at 4.4% year-over-year inflation, which is not ideal given that it is the 800-lb gorilla of CPI (weighing in at 44% of the measure). But outside of housing, the picture is quite different. Transportation took a nose dive in August, driven by the 10%+ year-over-year decline in gasoline prices, which based on the current trajectory of the oil commodity markets could face even more downward pressure in September. Moving to the right on the chart, food and beverages has magically settled at 2%. Meanwhile, Medical care has eased to 3%, which is actually quite low compared to its history (4.9%, as shown in the below chart). All other categories are below 2% inflation now aside from Other goods and services, which with a weight of just 2.4% is arguably not meaningful enough to matter.
Source: Bancreek Capital Advisors
Our fate is in the hands of a proxy survey now
With the Fed claiming its data dependence, it's no wonder that each and every data point will be highly scrutinized heading into what has been telegraphed to be the first rate cut of the cycle next week. Data dependence is great, but what happens when the data you rely on to make decisions no longer measures what you intended it to measure?
We ask this rhetorical question because it has become crystal clear to us that CPI is more a measure of OER than a measure of general inflation right now. And it's important to note that OER is not even a "real" thing, but rather an artificial construct. OER can't be purchased at a grocery story like eggs. You can't hire OER to mow your lawn. OER won't be able to fill your prescription. Rather OER is a survey of how much you thought you could get in rent for your house if, hypothetically-speaking, you decided to move somewhere else so you could collect this rent. Think of it this way... if there was an "OER" for eggs, it would be based on calls to people that aren't currently buying eggs asking how much they thought eggs would cost if hypothetically they started buying eggs. Sounds silly right? But that is in a nutshell how OER works.
To be sure, we are not discounting the importance of OER. It is important to know that one day when you do need to move (or in our analogy, when you decide to start eating eggs) that you are going to face a decent amount of inflation. This is helpful knowledge to have, in our view. But there is a difference between it being helpful knowledge and expecting the Fed to hinge its entire rate cutting strategy on a hypothetical survey. We suspect the powers that be at the Fed understand this. Either way, we won't have to wait long to find out!
Enjoying this post?
Tell others about it.

Bancreek's Actively Managed ETFs
If you are interested in learning more about Bancreek Capital Advisors' actively managed ETFs click the link below
Learn MoreMore articles like this
Fetching Related Posts
There are no other articles tagged with Research
