
Checkmate: CPI rises again in August ahead of stronger headwinds

Eric Pachman
Published
September 11th 2025
Eric Pachman
Published
September 11th 2025
August 2025 year-over-year inflation (CPI) jumps to 2.92% before gasoline inflationary pressure kicks into high gear.
This morning the Bureau of Labor Statistics released the August 2025 US CPI report for All Urban Consumers (CPI-U). Overall CPI-U was reported at 2.92% year-over-year (YoY) for August, up 22 basis points from 2.70% YoY last month. Meanwhile, Core CPI-U (excluding food and energy) was reported at 3.11% YoY, up five basis points from 3.06% YoY last month.
As a reminder, Bancreek publishes two visualizations that can help you explore CPI-U in granular detail. Both of these visualizations have now been updated through August and are embedded below:
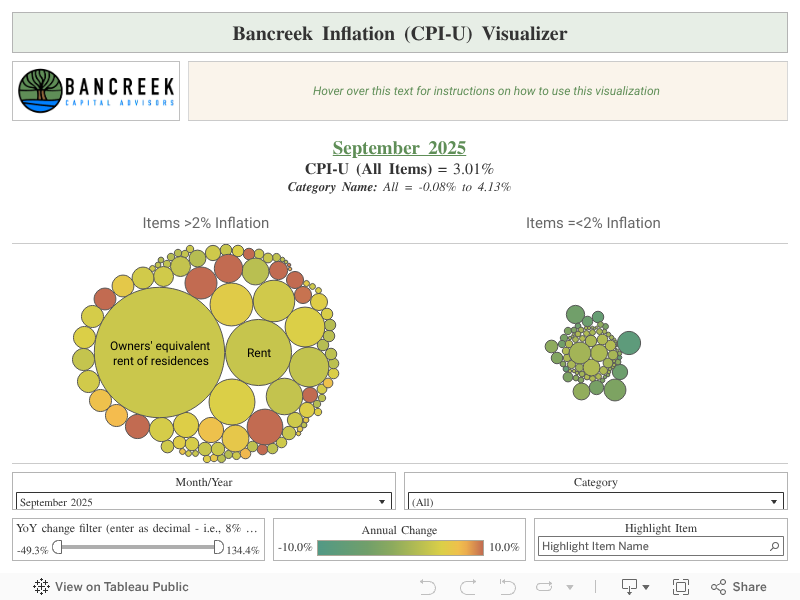
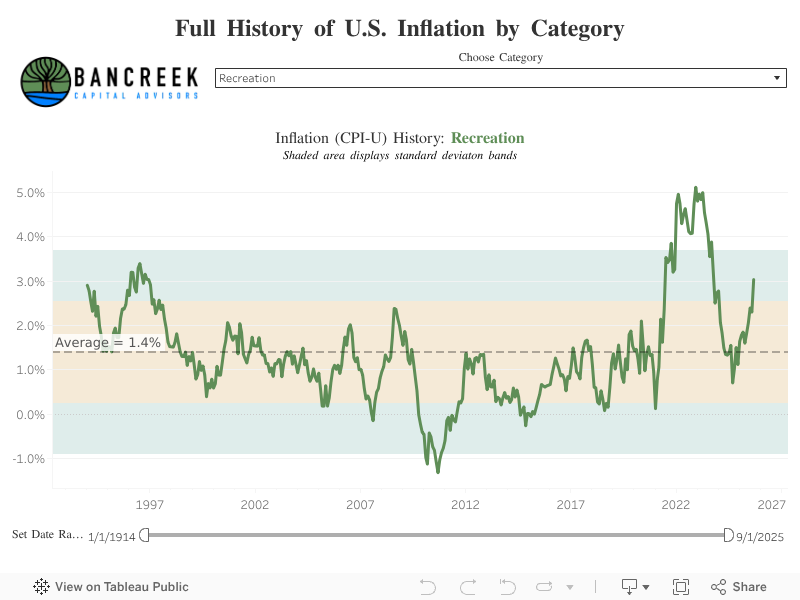
This post hopefully will further assist in your analysis of the moving parts underlying this month’s CPI report. Its goal is not to provide a comprehensive analysis of the nearly 180 items we track (that’s what the visualizations are for), but rather just to point to the most meaningful changes from one month to the next.
To perform this analysis, we track a measure we call “inflation impact,” which we calculate by multiplying each item’s YoY inflation by its weight in the prior year period. You can think of this as “weighted inflation” as opposed to the “unweighted inflation” that is more commonly reported by the media. Each month we take the weighted inflation of each item we track in CPI-U and then sum them up to overall CPI-U. Then we compare these weighted inflation numbers from one month to the next to see what drove the sequential increase or decrease. In this way, we can precisely identify the most significant drivers in the change in YoY CPI-U from one CPI report to the next.
Ho-hum headline, uh-oh details
On the surface, this morning's CPI data release was reported in line with consensus (both headline and core). But, as we will show you in today's post, it's hard to find inspiration in this "win" when we start digging down into the item-level detail. The fact is that inflation is popping up in many areas of the economy now, most of which we cannot logically pin on tariffs (which people have come to accept to be "transitory"). Shown below are the major incremental drivers of the increase in YoY inflation from July to August.
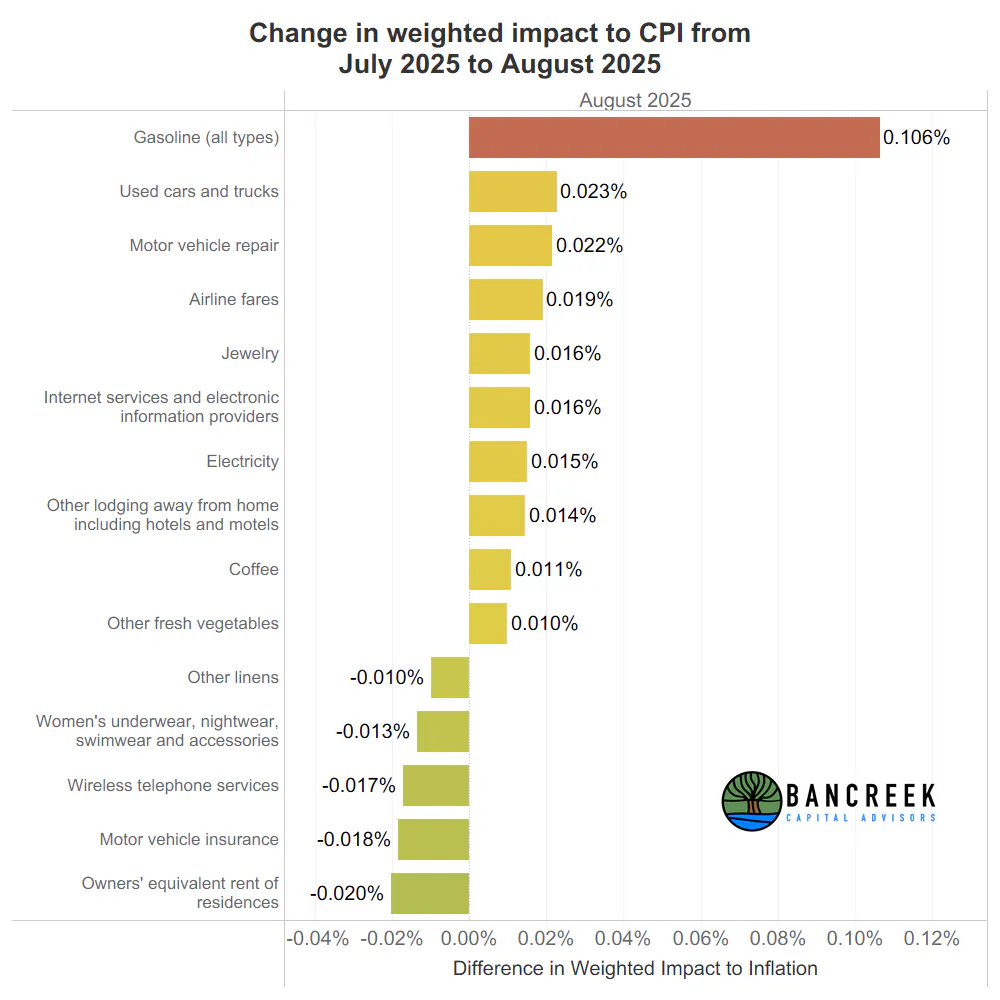
Source: Bancreek Capital Advisors, LLC analysis of data from bls.gov
Let's change it up this month and start with the main disinflationary forces in August (i.e., the "good news").
Auto insurance declines!
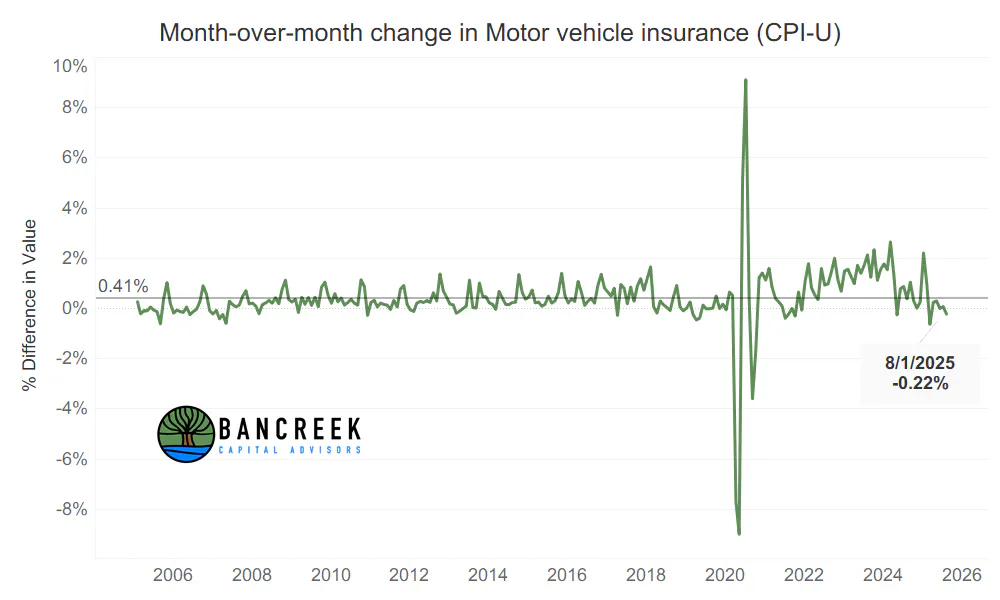
In our view, the best news in today's report was the month-over-month decline in Motor vehicle insurance.
Source: Bancreek Capital Advisors, LLC analysis of data from bls.gov
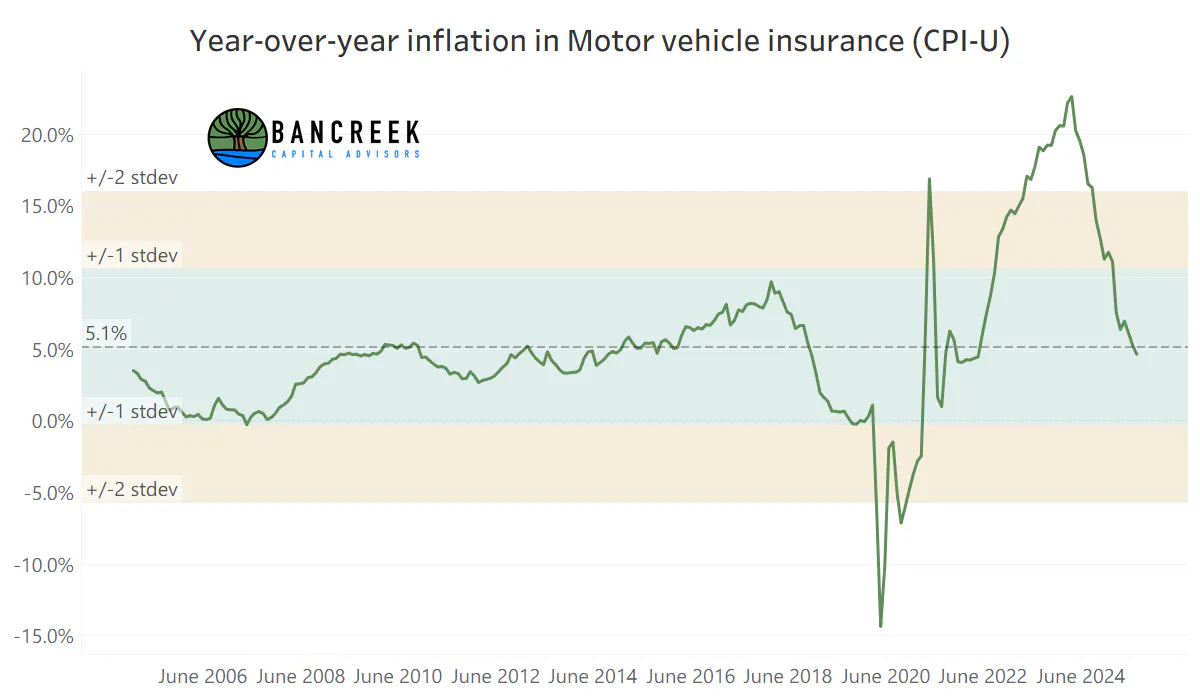
August's weak print for this item adds to a string of relatively weak numbers that now stretch all the way back to March. Thanks to this string of healthy sequential inflation prints, YoY inflation for this item is all the way down to 4.7%.
Source: Bancreek Capital Advisors, LLC analysis of data from bls.gov
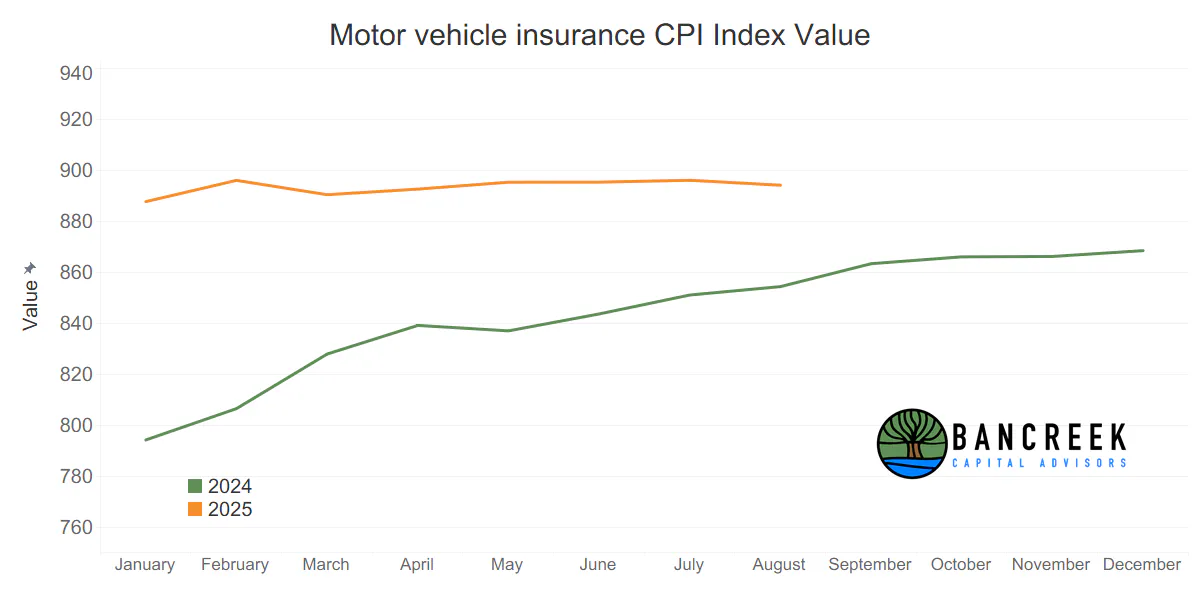
But good news for August quickly can be flipped to concern going forward. Note that 4.7% is now below the long-term average YoY inflation for Motor vehicle insurance. So, how much more can this correct? Our point is that each month we get a disinflationary benefit from this item, we are one month closer to running out of this benefit, which means we need other items to take up the disinflationary mantle. The problem with that is there are no items out there that have the combination of high weight and high inflation that we can look to for disinflation benefits as they mean revert.
For those looking for some good news in the short-term, if this item can stay flat on a sequential basis in September, that will chop its YoY inflation down to 3.6%. That would shave three basis points off headline inflation, which would be helpful. But then thanks to the magic of cycling prior year comparisons, we'll get very little additional disinflationary help all the way through the end of 2025. And again, that assumes zero sequential inflation for the item for the rest of the year.
Source: Bancreek Capital Advisors, LLC analysis of data from bls.gov
Shelter inflation eases on comps, but jumps sequentially
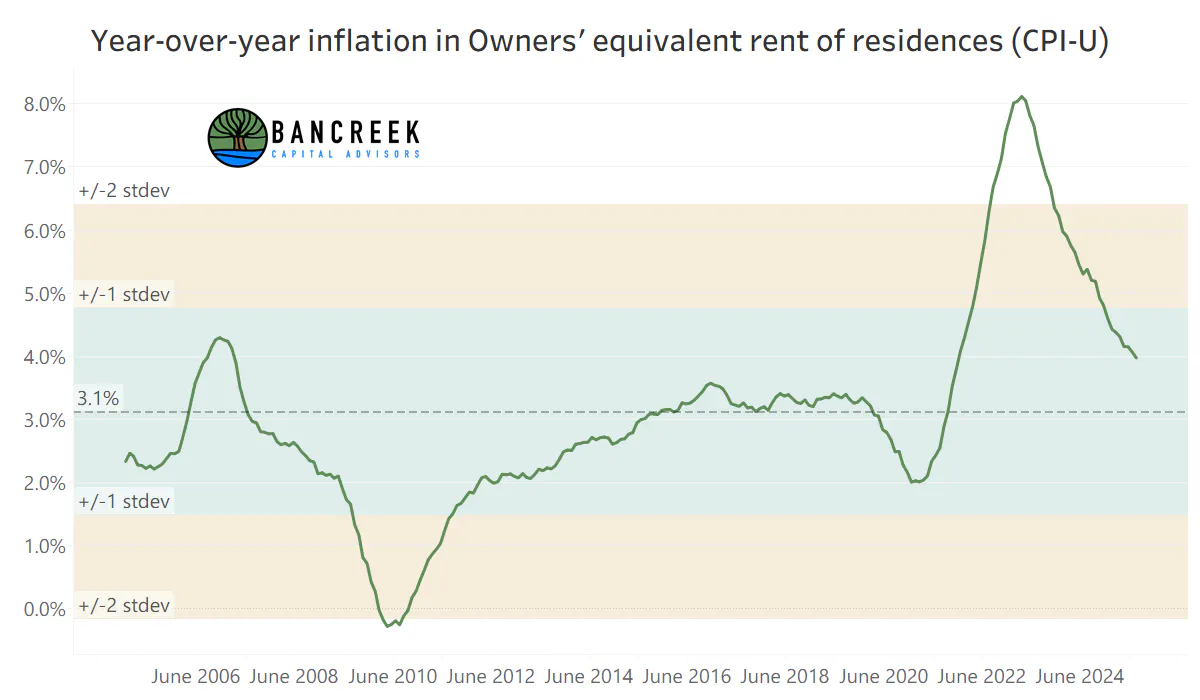
On the surface, the below chart is wonderful news. The massive (26.8% weight of CPI!) Owners' equivalent rent of residences (a.k.a., "OER") fell to 4.0% YoY inflation in August from 4.1% YoY inflation in July.
Source: Bancreek Capital Advisors, LLC analysis of data from bls.gov
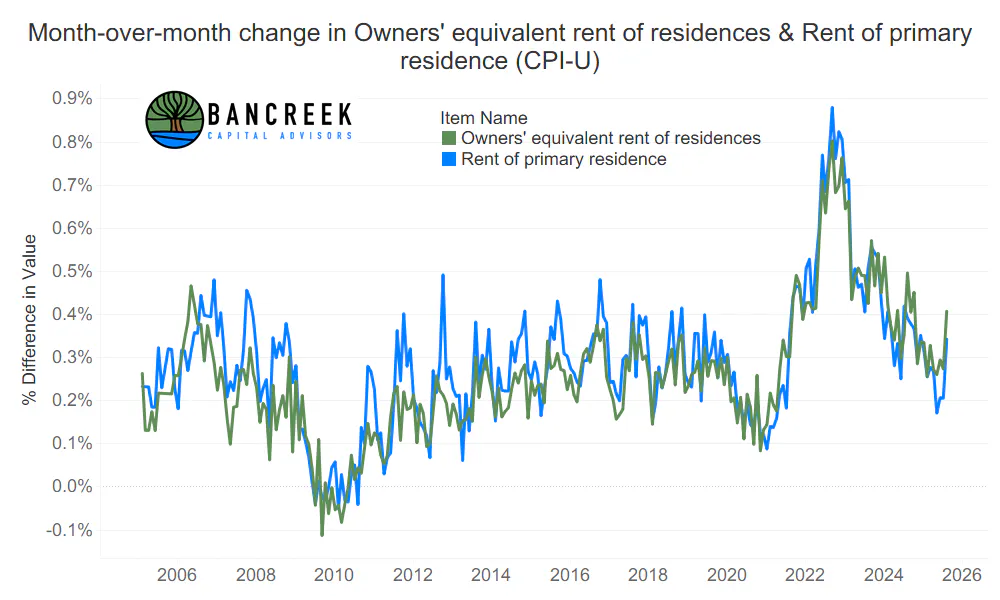
Again, the devil lies in the details with this item. When you switch from annual inflation to sequential inflation, we see much more concerning data.
Source: Bancreek Capital Advisors, LLC analysis of data from bls.gov
As shown above, OER jumped to a 0.41% MoM increase in August. That's the highest sequential inflation print for this item since October 2024! Also note that this this latest sequential number annualizes to 5.0% inflation.
Just pause and think about this for a moment... An item that is nearly 27% of all of CPI just put up annualized 5.0% inflation, following nearly a year of muted inflation prints.
Clearly, the market has decided that this must be an anomaly (or it is not paying attention to the granular data) because if there is any real risk it is not an anomaly and OER really does start moving back towards 5%, this would pull headline and core inflation up by 30 basis points. Between this dynamic and the coming YoY inflationary pressures on gasoline, we may not even be debating how soon CPI crosses above 3% in several months (this will almost certainly happen next month)... but instead when it will round up to 4%.
That about covers the "good" news this month. Now we will turn to the bad news.
Gasoline inflationary pressures have arrived
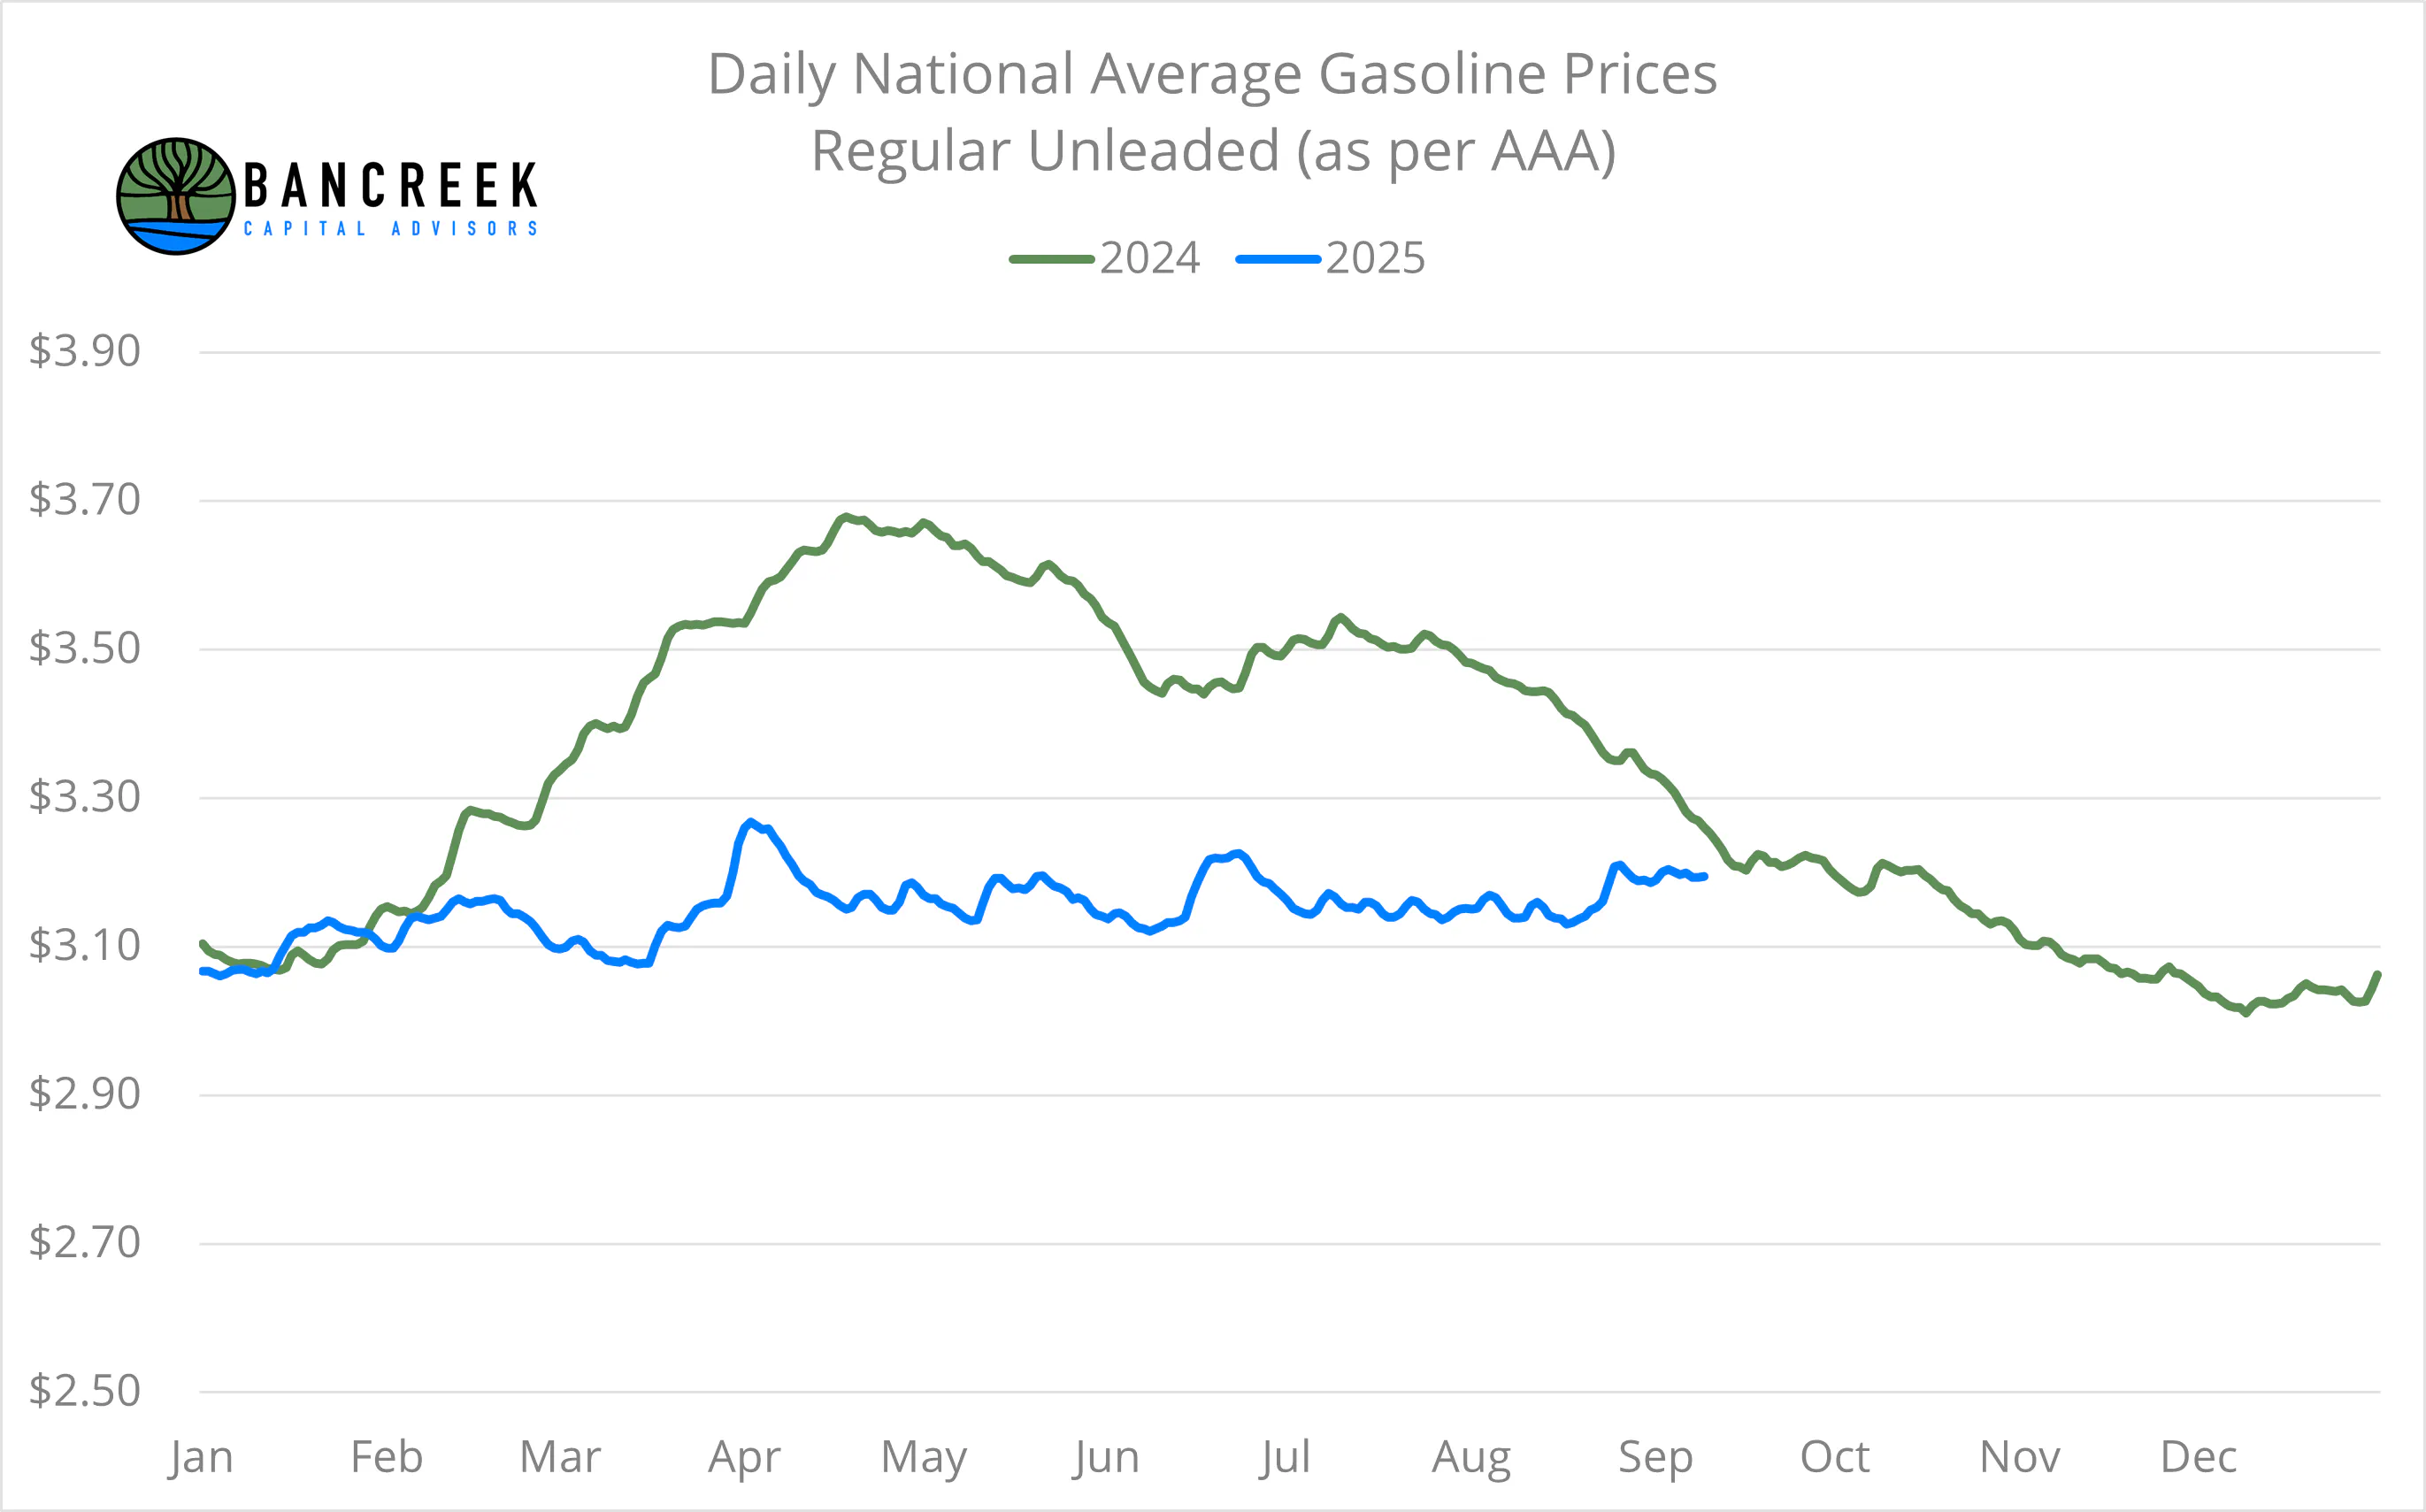
This month's top inflationary impact item (on the margin) was gasoline, adding 11 basis points to YoY inflation in August. Sadly, this was tame upward pressure compared to what it likely coming. Take a look at the chart below, which we have been showing all year. We have finally reached the point where we are now about to cycle large declines in 2024 gasoline prices.
Source: Bancreek Capital Advisors, LLC analysis of data from bls.gov
As shown above, barring a serious correction to prices at the pump, we are literally just days away from running out of deflationary juice in gasoline. Average September 2025 prices at the pump (according to AAA) are still stuck at $3.20 per gallon. That's just -1.4% below September 2024's $3.24 per gallon. Note that this is meaningfully lower deflation than CPI reported in August (-6.6%). Fast forward to October 2024, November 2024, and December 2024 and average retail prices fell to $3.17, $3.08, and $3.03 per gallon, respectively. In short, if we don't see gasoline prices budge from where they are now, we should expect gasoline's inflation impact to go from -22 basis points in August to +19 basis points. That's 41 basis points of upward pressure to headline CPI from this one item! In other words, if gasoline prices don't budge through year-end, expect headline CPI to be 3.4%.
Moonshot in Motor vehicle repair
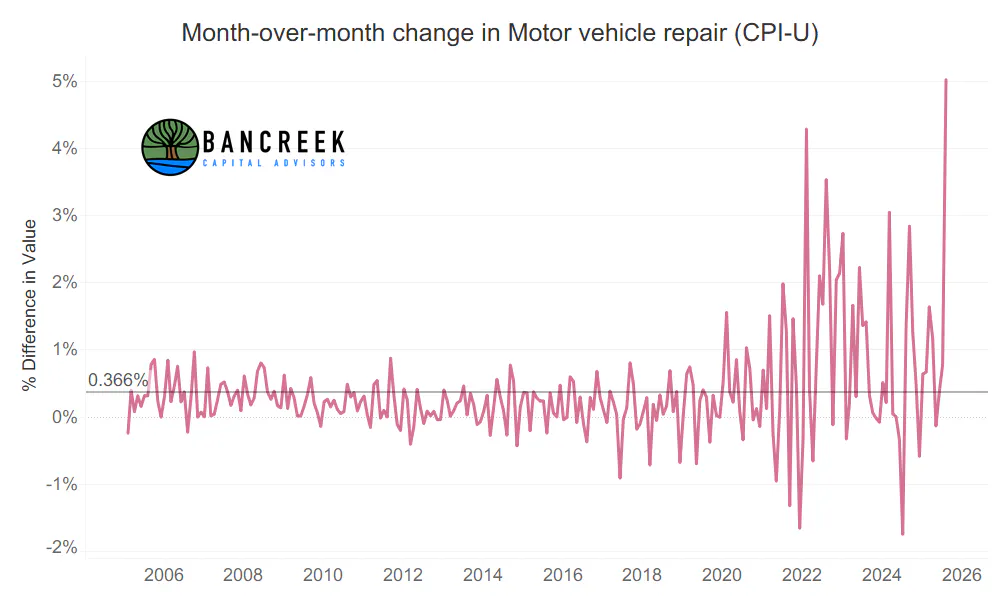
We really don't have any words for this chart so we'll just drop it on you.
Source: Bancreek Capital Advisors, LLC analysis of data from bls.gov
Keep in mind those are sequential numbers. So, we just saw a 5% increase in the price of Motor vehicle repair from July to August! Who had that on their bingo card?
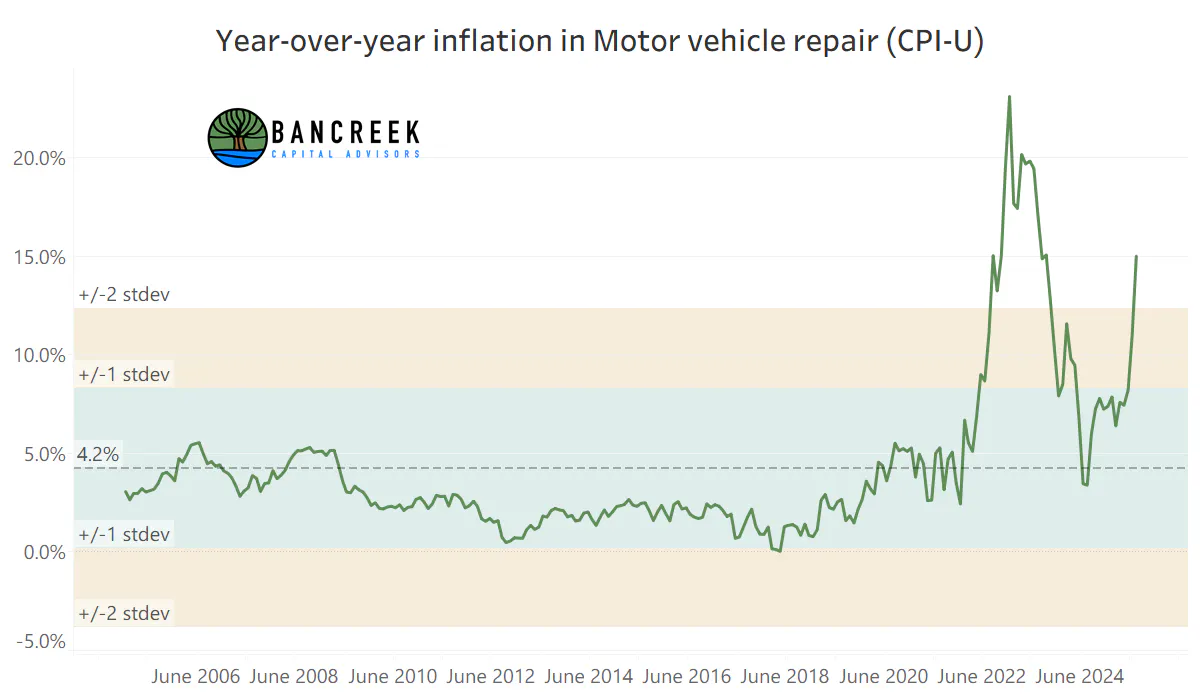
Of course, it's not surprising that the YoY inflation on this item surged as well.
Source: Bancreek Capital Advisors, LLC analysis of data from bls.gov
Keep in mind, this category isn’t trivial within CPI - it carries a 0.52% weight. If it continues to run at double-digit inflation, on its own it could create headaches for the Fed.
A tour of the remaining "red bubble" items
If you look at our flagship CPI data visualization, you will see more and more "red bubbles" creeping into the visual. Red bubbles denote items that are inflation at a rate of ~10% or more YoY. To save time, we'll drop the trend charts of a selection of these items in below (click on the arrows to cycle through images). Of course, you can explore them all yourself if you use our viz.
A tour of the large and rising "yellow bubble" items
If you really want to get an edge on where inflation is headed, it's not enough to just look at the red bubble items. We recommend also looking at the larger yellow bubble items (mid single digit YoY inflation) that are showing an upward trend. These are items that have high weights and are also adding incremental inflationary pressure over time. In other words, these are the items that, if they continue to follow trend, can really throw a wrench in our dovish hopes and dreams. We also included one "green bubble" in the image carousel (New vehicles) as it is showing a steady upward trend which could also cause problems (if this continues) given its very high weight of CPI (3.58%).
Do you want to play checkers or chess?
Right now, it feels like we are playing an altogether different game than the broader market. The market is playing checkers. It’s a straightforward approach: “buy into the first rate cut,” especially as each new data point reinforces that cuts are coming. Every release is viewed from 30,000 feet, then plugged into the same easing-cycle playbook.
We, however, are playing chess. We care less about the first cut itself and more about the longer-term trajectory of labor and inflation once rates begin to move. The key question isn’t when the Fed cuts, but whether those cuts will actually work. Even Chair Powell has acknowledged that monetary policy has little power over structural changes in the U.S. economy - and structural change is exactly what we believe we’re facing.
So each investor must decide: which game are you playing?
If you’re a long-term investor, you care more about the outcome (the economy’s trajectory) than the tool being used (monetary policy). If that resonates, you’re playing chess - and you may find our work particularly valuable.
If you’re a short-term trader, the tool itself - its size, shape, and timing - matters more than its ultimate impact. There’s nothing wrong with playing checkers, but be alert: the rules of that game can change quickly. If monetary policy proves less effective than in past cycles, even those focused on the first cut may find the economy staring down checkmate.
Stay ahead with research-backed perspectives on labor markets, investments, and economic shifts by exploring more resources at Bancreek Capital Advisors
Enjoying this post?
Tell others about it.

Bancreek's Actively Managed ETFs
If you are interested in learning more about Bancreek Capital Advisors' actively managed ETFs click the link below
Learn MoreMore articles like this
Fetching Related Posts
There are no other articles tagged with Research
