
Checking the tape - Key takeaways from April 2024 CPI-U inflation

Eric Pachman
Published
May 15th 2024
Eric Pachman
Published
May 15th 2024
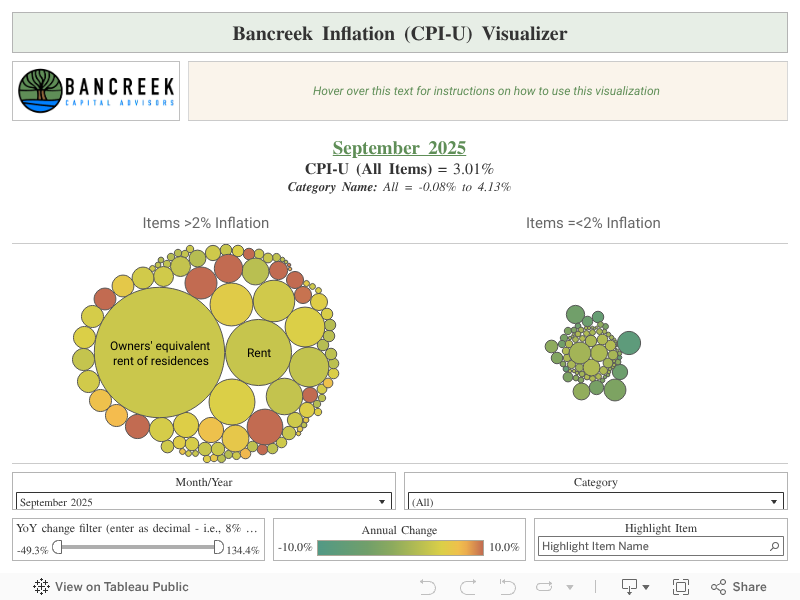
We have great news for you this month – this post will be very brief! Because, objectively speaking, not much changed from last month. To illustrate this, we took snapshots of our Bancreek Inflation (CPI-U) Visualizer from March 2024 and April 2024 and put them next to one another. Take a look below to get a sense for how little changed in today’s print:
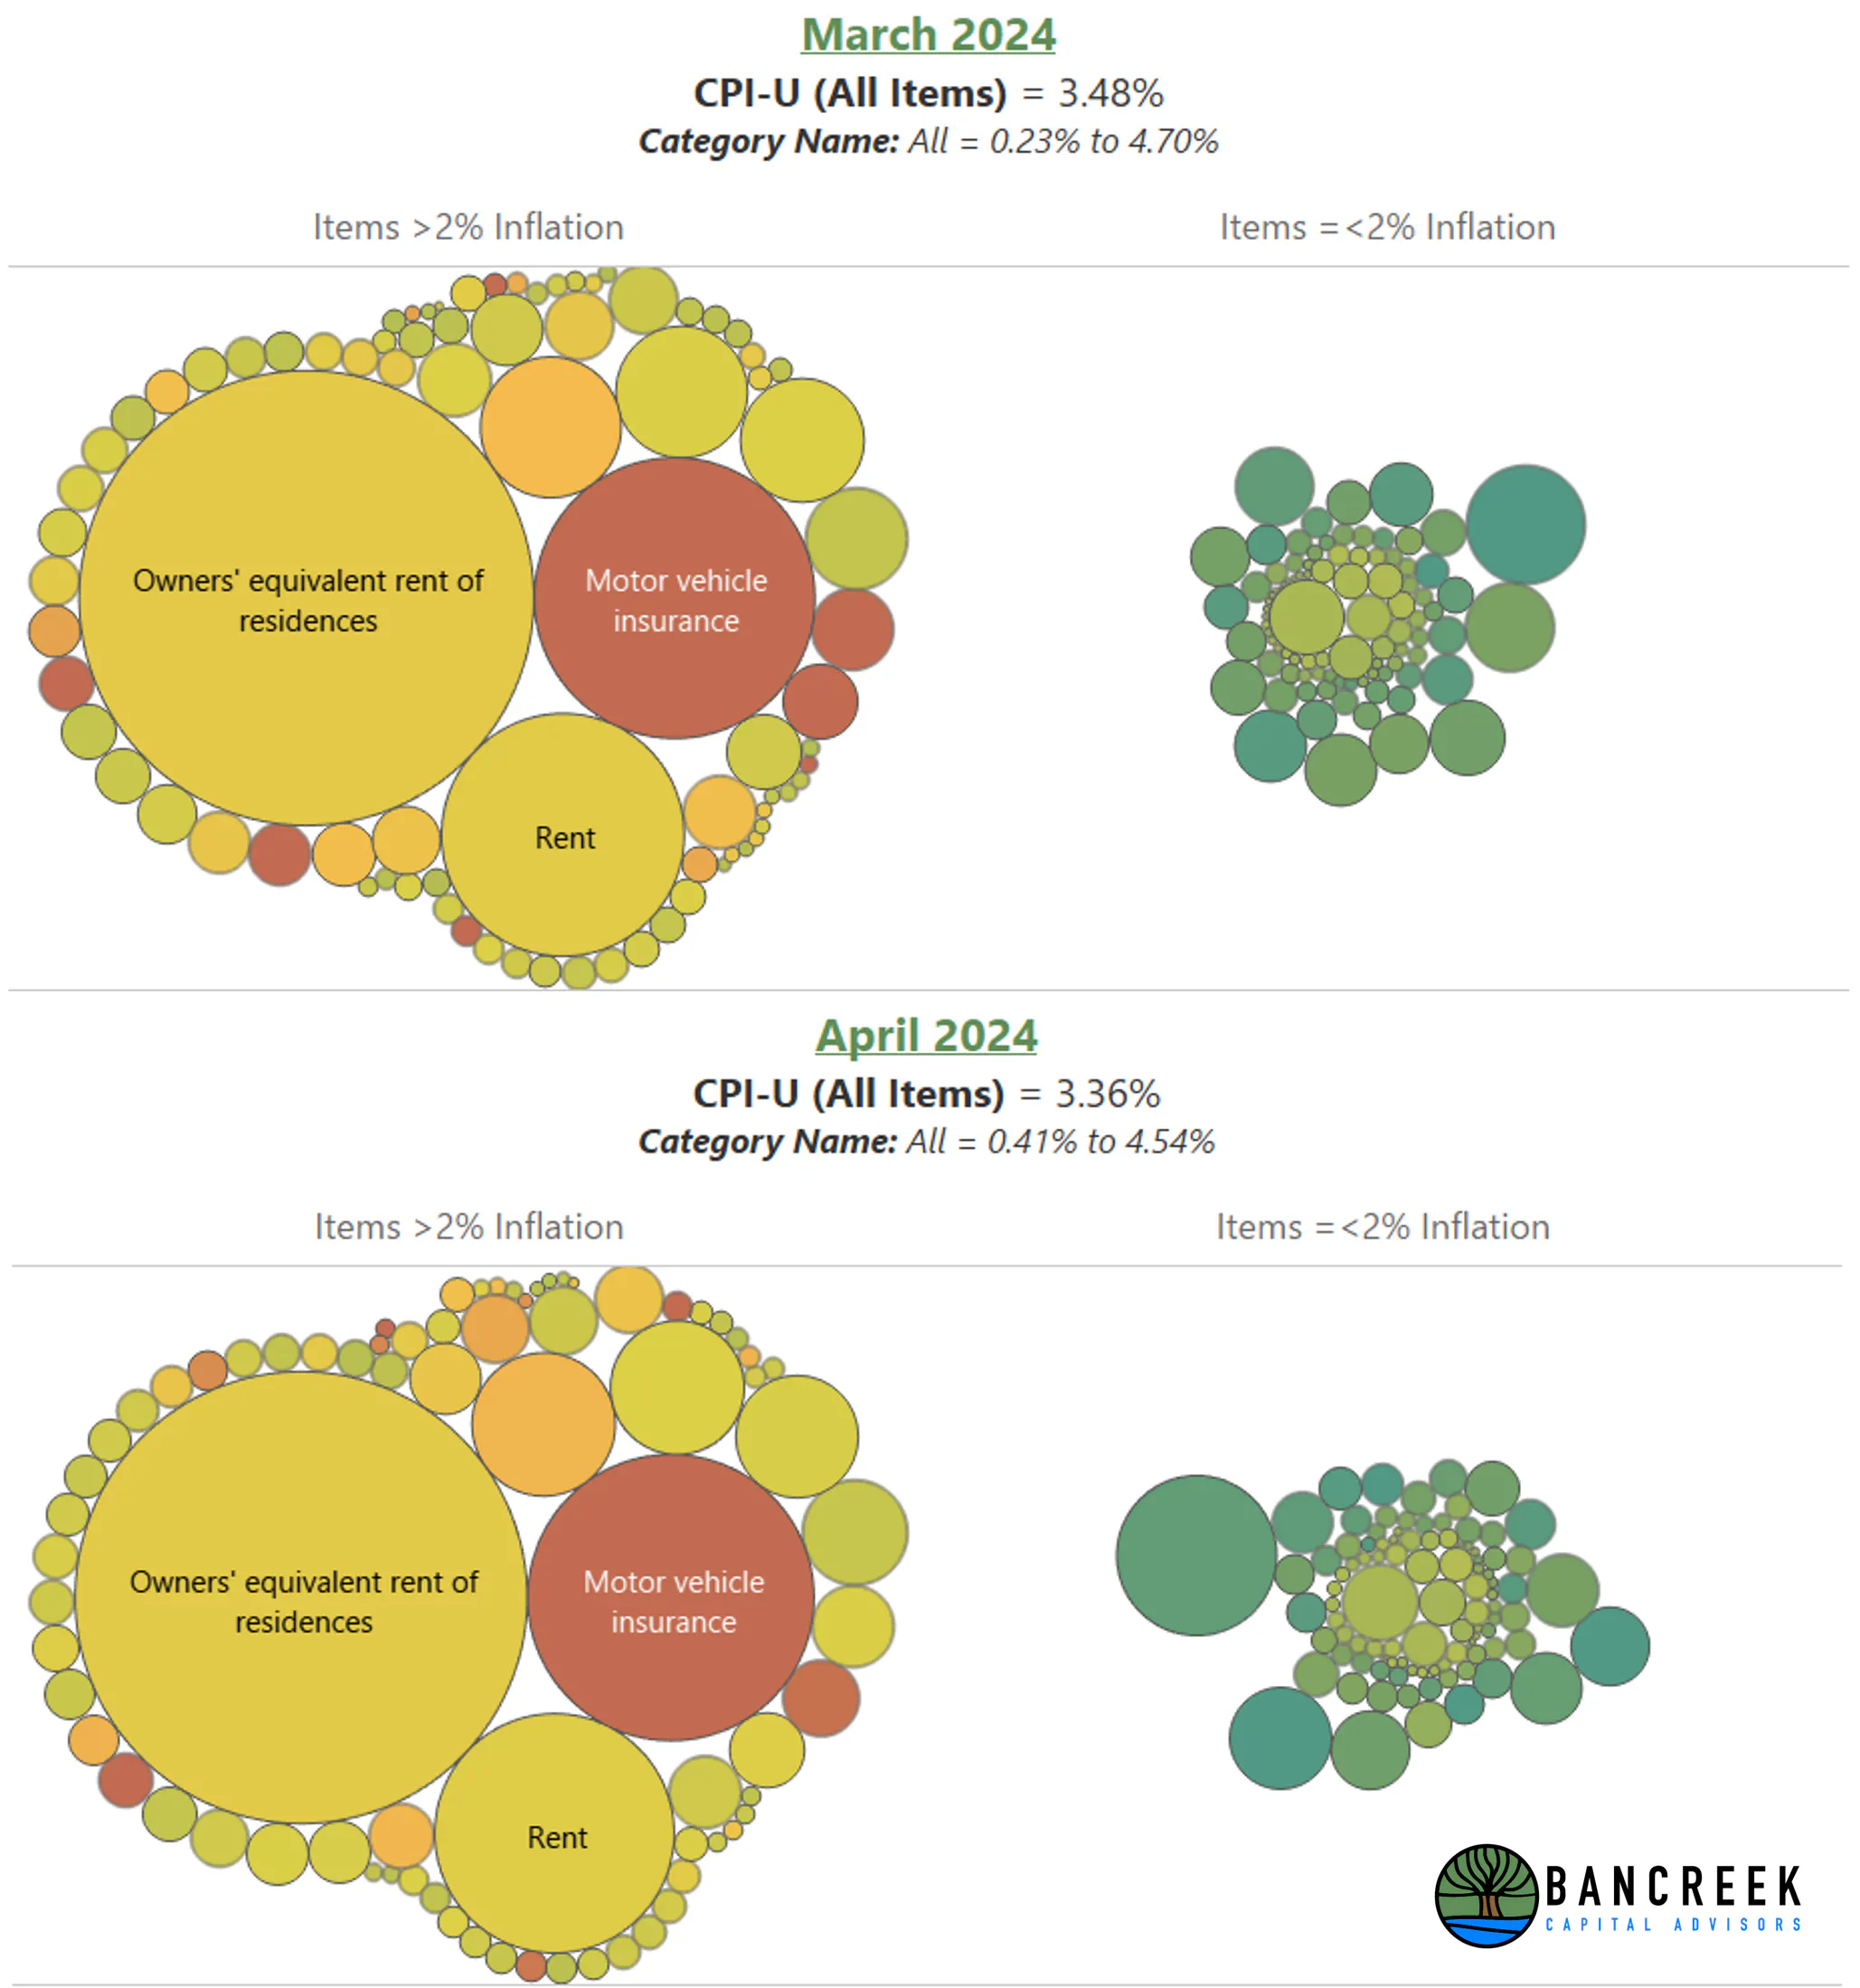
Source: Bancreek Capital Advisors, LLC
This reminds us of going to the eye doctor to get a prescription.
Question: Which lens is clearer? One… or two?
Answer: I don’t know. They both look the same.
Thankfully we have additional data tools that allow us to see more than meets the naked eye. To start, we simply ranked all the items by their inflation impact (reminder: "inflation impact" = weighted inflation) for March 2024, and then repeated this exercise for April 2024. Then we lined those two columns up side-by-side to see what changed.
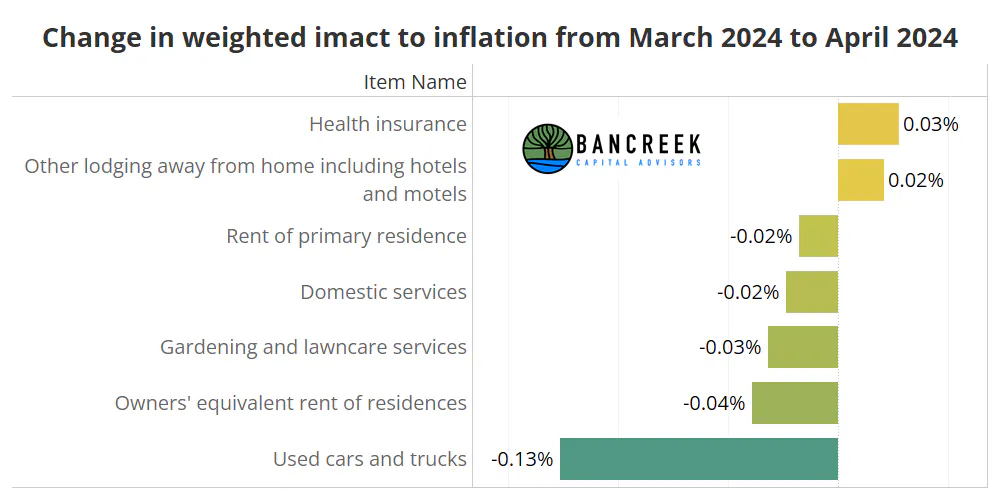
Let’s go through a quick example to make this crystal clear. As you will see in our CPI-U bubble chart viz, in March 2024, everyone’s favorite CPI-U item – which of course is Owners’ equivalents rent of residences (a.k.a. OER) – had a year-over-year inflation impact of 150 bps. Fast forward to April 2024 and its year-over-year inflation impact declined 146 bps. So, that’s a 4-bps improvement this month compared to last month. We went through this exercise for the 175+ items we track and, as shown in the chart below, found only seven items whose inflation impact changed by +/- 2-bps from March to April.
Source: Bancreek Capital Advisors, LLC
Clearly, one of these seven items really stands out – Used cars and trucks. This one item shaved 13-bps from CPI-U in April versus its inflation impact in March. This is notable because we calculate the total drop in overall CPI-U to be 12 bps MoM. So, if you are looking for a simple, clean explanation for what happened this month, you are in luck - we can all largely thank the additional deflationary pressure in Used car and truck prices for the sequential easing in inflation.
Source: Bancreek Capital Advisors, LLC
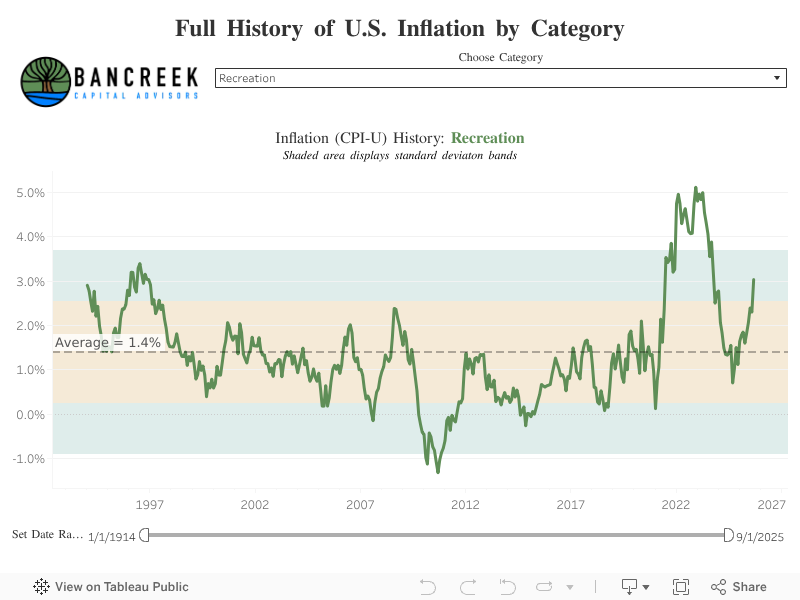
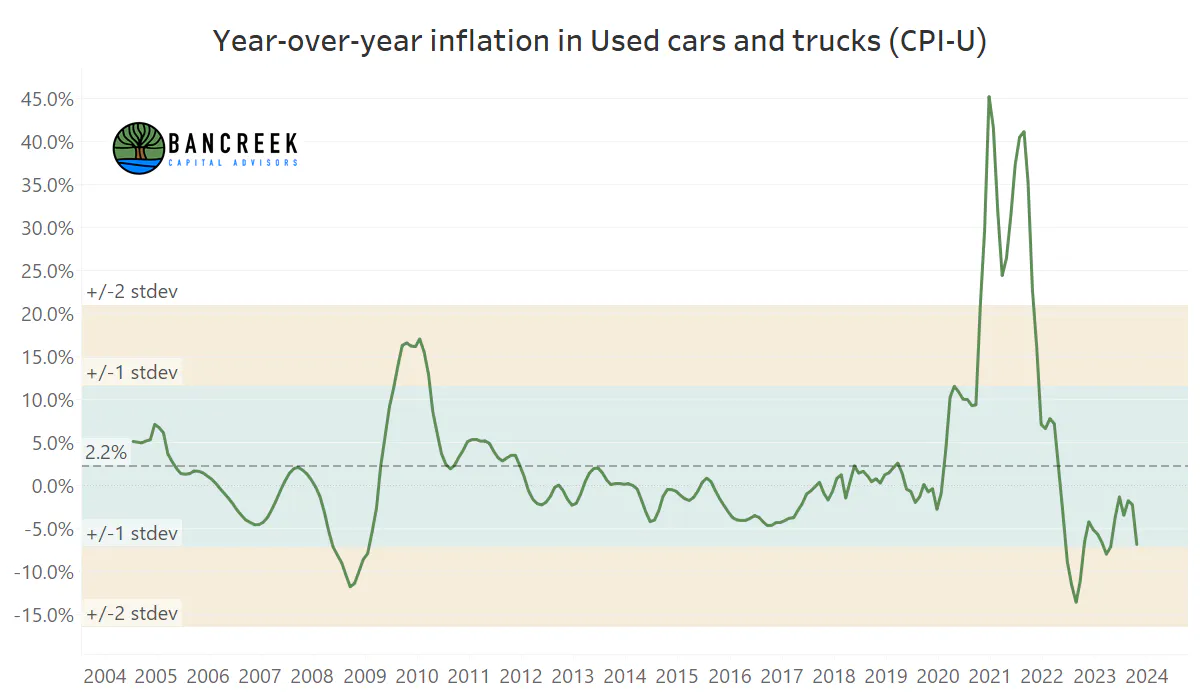
Case closed, right? Not so fast. Take another look at the above chart. Used car and truck year-over-year inflation went from -2.2% in March 2024 to -6.9% in April 2024. Mean inflation for this category dating back to 2004 is 2.2%, with a standard deviation of 9.4% (the green shaded area). What we take away from the data is that this month’s move in Used cars and trucks is within range of normal volatility for this item. Certain items, like Used cars and trucks, Airline fares, and Gasoline, are just more volatile by nature. So, we tend to not get too excited about month-to-month fluctuation in these items, especially when it is within a standard deviation of their respective means. Since we are not Used car and truck forecasting experts, we rely on the historical data to tell us this category could have easily been -2.2% again in April. For that matter it could have been 6.9% inflation and it would have been in the range of normal volatility for this category.
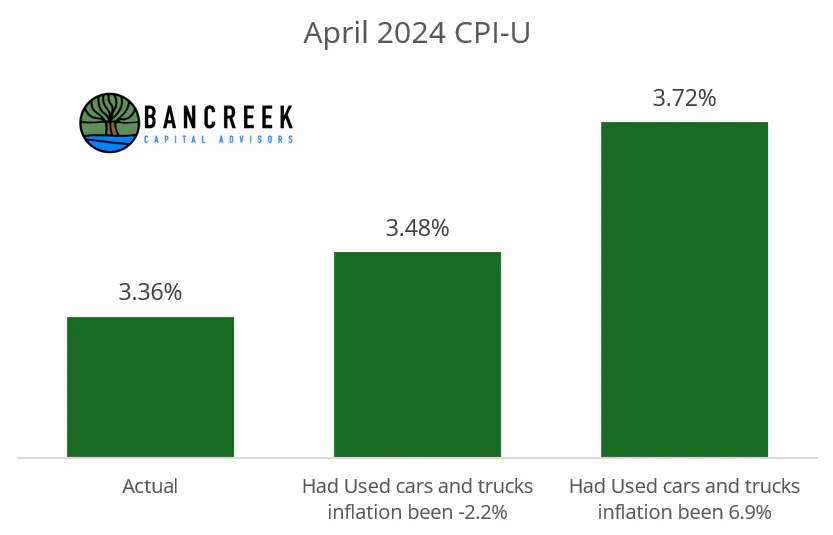
You may see where we are going with this, especially if you are following the market rally occurring as we write these words on this “in-line” CPI-U print. The market is celebrating something that is, in our view, completely random in nature. To illustrate this, let’s recalculate what CPI-U would have been today if Used cars and trucks would have come in at -2.2%, equal to last month. When we do the math, we get that overall CPI-U would have been 12 bps higher, which puts it exactly in line with March 2024 to two decimal places. What if Used cars and trucks randomly flipped to 6.9% inflation this month (which again, shouldn't be outside the realm of expectation for this item)? Well, overall CPI-U would have been 3.72%. Care to guess the market’s reaction to that headline number?
Source: Bancreek Capital Advisors, LLC
Our point here was expertly made this morning by Tej Parikh, Economics leader writer for the Financial Times in an opinion piece published this morning titled, “What even is inflation?” which featured some of Bancreek’s analysis. If you haven’t read Tej’s fantastic work, we’d strongly urge you head over to the FT Alphaville and read it.
Our main takeaway from the post is that the more you study the inner workings of U.S. inflation data, the more you are left shaking your head at the entire feedback loop that seems to cascade from minor changes in the measures. Today’s findings are just another example of this. We assume that people are excited about the implications a lower headline number have on the Fed's rate decision. But a cursory analysis reveals that the sequential decline was arguably entirely driven by an arbitrary and very normal move in a single item. It’s hard to walk away from this month's data with any other takeaway than that we benefitted from a favorable coin flip on one CPI-U item.
But as we said in Tej’s piece, “If the market is a carnival, one of the hottest attractions is the inflation fun house, jam packed with distorted mirrors. Digging into the data helps expose the mirrors for what they are.”
Have fun at the carnival today. But when you feel like exposing the mirrors for what they are, Bancreek is here for you.
Enjoying this post?
Tell others about it.

Bancreek's Actively Managed ETFs
If you are interested in learning more about Bancreek Capital Advisors' actively managed ETFs click the link below
Learn MoreMore articles like this
Fetching Related Posts
There are no other articles tagged with Research
