
Key takeaways from the June 2024 Consumer Price Index release

Eric Pachman
Published
July 11th 2024
Eric Pachman
Published
July 11th 2024
June 2024 year-over-year inflation comes in 30 basis points lower than prior month
This morning the Bureau of Labor Statistics released the June 2024 Consumer Price Index for All Urban Consumers (CPI-U). Overall CPI-U was reported at 2.97% year-over-year (YoY) for June, down 30 basis points from 3.27% year-over-year last month.
As a reminder, Bancreek Capital Advisors publishes two visualizations that can help you explore CPI-U in granular detail. Both of these visualizations have now been updated through June and are embedded below:
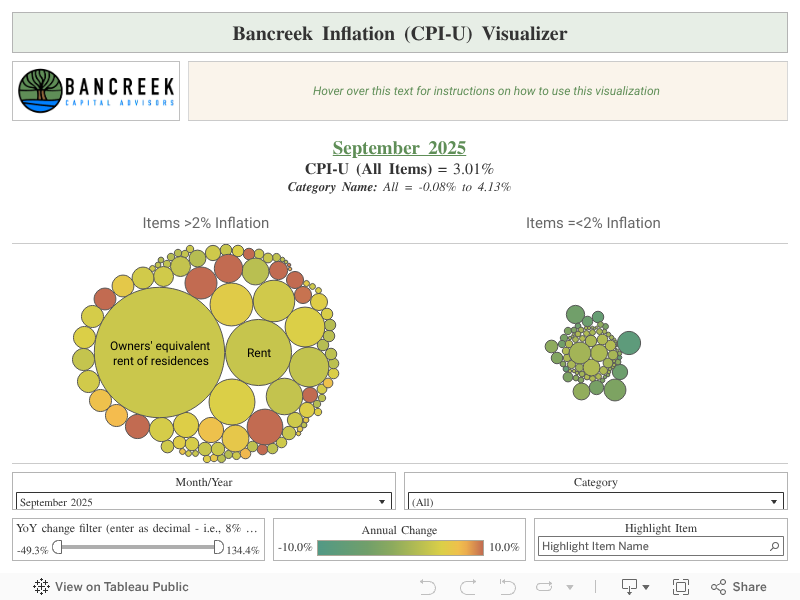
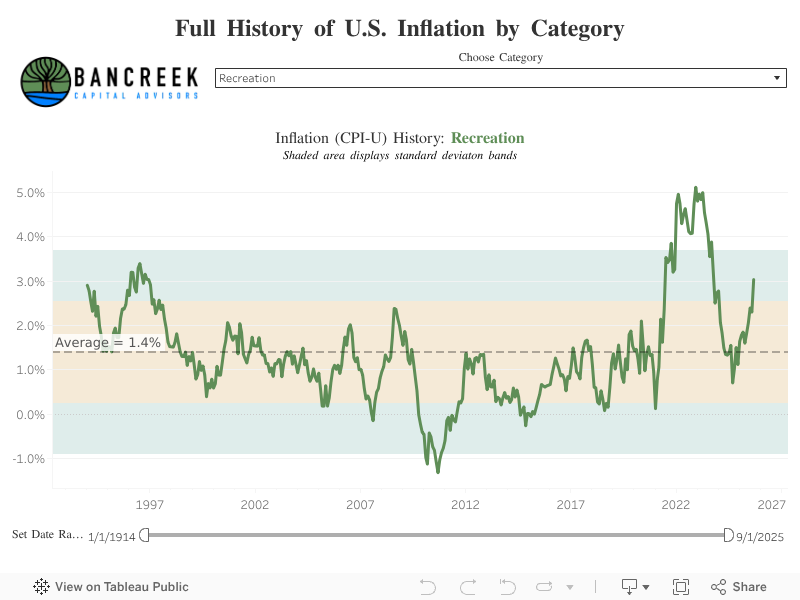
This post hopefully will further assist in your analysis of the moving parts underlying this month’s CPI-U print. Its goal is not to provide a comprehensive analysis of the nearly 180 items we track (that’s what the visualizations are for), but rather just to point to the most meaningful changes from one month to the next.
To perform this analysis, we track a measure we call “inflation impact,” which we calculate by multiplying each item’s YoY inflation by its weight in the prior year period. You can think of this as “weighted inflation” as opposed to the “unweighted inflation” that is more commonly reported by the media. Each month we take the weighted inflation of each item we track in CPI-U and then sum them up to overall CPI-U. Then we compare these weighted inflation numbers from one month to the next to see what drove the sequential increase or decrease. In this way, we can precisely identify the most significant drivers in the change in YoY CPI-U from one month to the next.
Gasoline drives over half of favorability in year-over-year inflation versus prior month
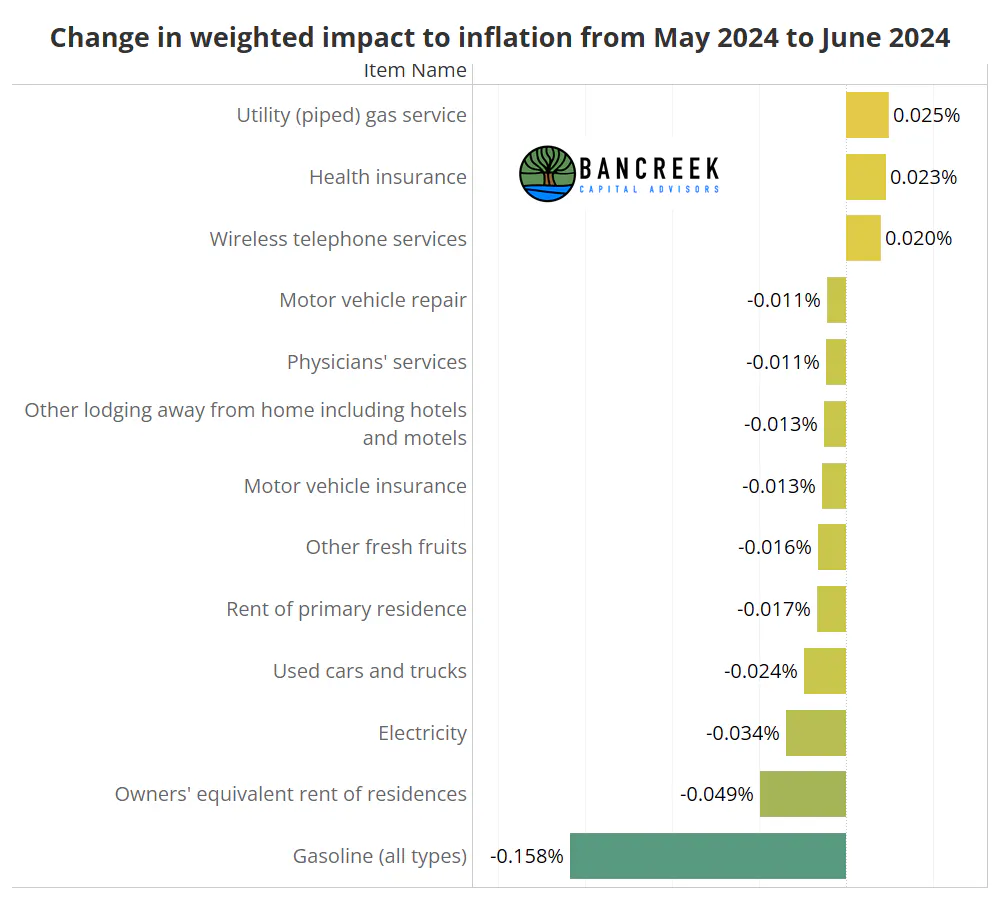
Again, in June 2024, overall YoY CPI-U declined by a healthy 30 basis points from May 2024 CPI-U. When we look at the change in item-level inflation impact from May to June, we see that the largest favorable move was in Gasoline, which shaved 15.8 basis points off YoY inflation alone. As shown in the chart below, the other items that were most favorable were Owners' equivalent rent of residences (4.9 basis points favorable), Electricity (3.4 basis points favorable), Used cars and trucks (2.4 basis points favorable), Rent of primary residences (1.7 bps favorable), and another five items that all were favorable by more than 1 basis point versus last month. These most favorable items were partially offset by unfavorable moves in Piped gas service (2.5 basis points), Health insurance (2.3 bps), and Wireless telephone services (2.0 basis points). Note that these were the only three items (again, out of nearly 180 items) that showed an unfavorable impact of more than 1 basis point. So, all told, while the decline in gasoline inflation was the biggest driver of favorability, the data suggests that many more items are working to push inflation down than are working to bring it up.
Source: Bancreek Capital Advisors, LLC
Key housing inflation measures moderate
If we put our pencils down now, we would walk away with the takeaway that Gasoline dominated the release. That's not all that exciting given that gasoline is "non-core" and highly volatile. But when we dug further, we walked away with a much more critical takeaway - Owners' equivalent rent of residences (OER) and Rent of primary residences seriously moderated in June 2024. Moderation in these two key housing items is absolutely essential for overall CPI-U to flirt with 2%. And this is not just our opinion... it's math. These two items together carry a weight of 33% of CPI-U. You read that right. Rent and OER (which is a rent proxy for homeowners) make up a full third of the entire CPI-U inflation measure. Clearly, if a third of CPI-U is clocking in at nearly 6% year-over-year (which is where OER and Rents have been for a while now), the other two-thirds of the CPI-U items have to come at essentially zero to get to 2% (6% x 33% =1.98%).
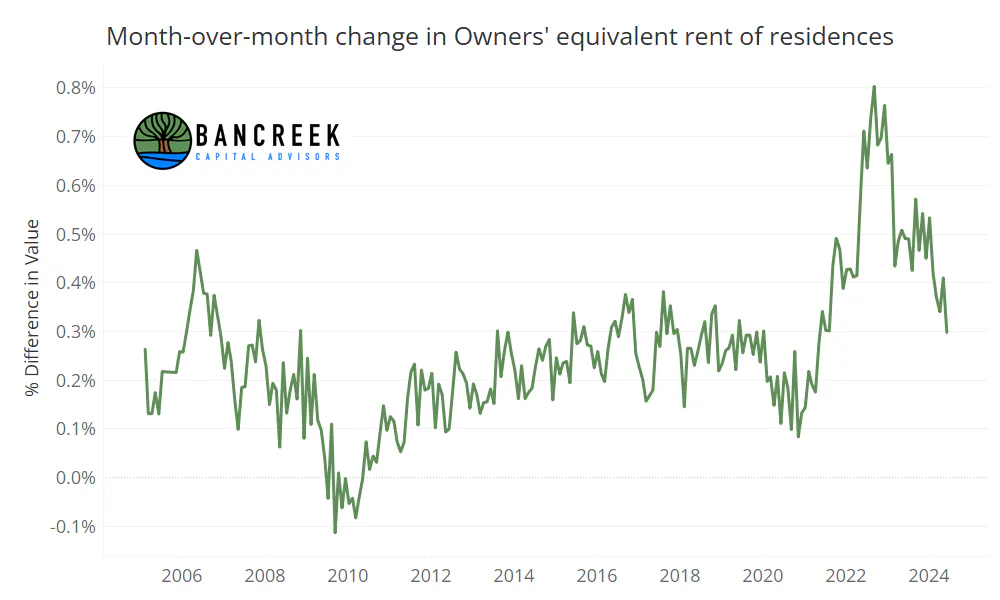
Once you see this math, CPI-U analysis becomes quite simple - immediately figure out what happened to OER and Rents and then study everything else. With that said, we were highly encouraged by this month's release which showed notable moderation in the month-over-month inflation in these two measures. Please do not confuse the charts below with the month to month comparisons we have done so far in this post. To this point we have been comparing year-over-year inflation from one month to the next. The charts below shows the inflation from one month to the next (i.e. MoM).
Source: Bancreek Capital Advisors, LLC
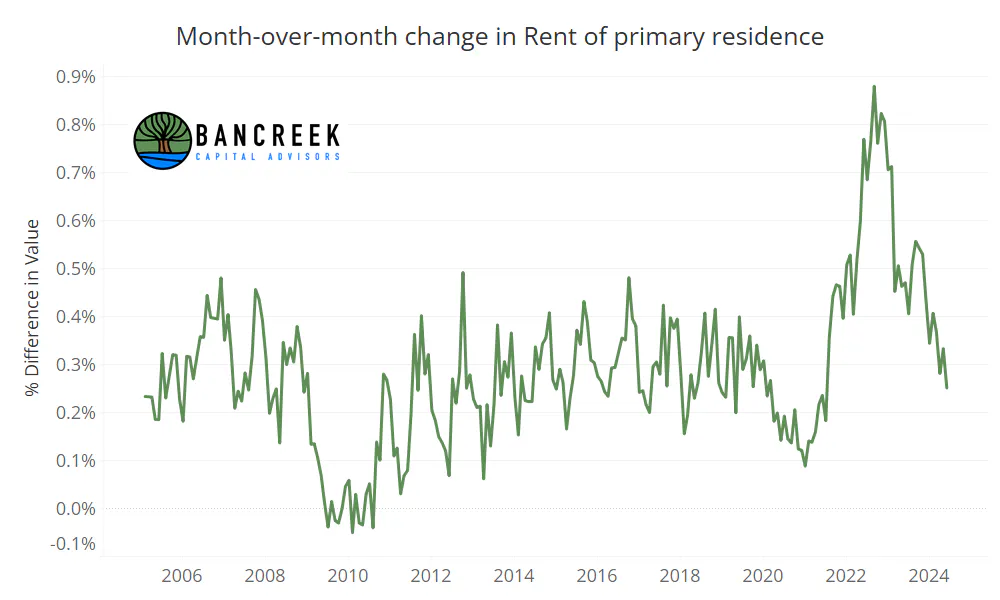
Source: Bancreek Capital Advisors, LLC
While the above charts make this readily apparent, it's worth emphasizing anyway that both of these key housing measures are down to MoM inflation levels not seen since 2021. OER is below 30 basis points of MoM inflation, down from over 40 basis points last month and a whopping 80 basis points of MoM inflation at the peak in September 2022. Meanwhile, at just 25 basis points of MoM inflation, Rents is firmly back within its long-term average.
These numbers are quite exciting in our view as we can start to forecast what CPI-U could drift down towards if (and that's a big IF) these two measures can hold these MoM inflation rates. So, let's dream a bit and run-rate June's MoM inflation rates forward. Note that we are not modeling any more improvement here on a MoM basis - just trying to understand what CPI-U could look like if June 2024's inflation persists through the year. The answer is that in this "no change" scenario OER inflation drops to 4.2% (from 5.4% this month) and Rents inflation drops to 3.5% (from 5.1% this month) by year end. If this happened it would push overall CPI-U down to 2.5% by the end of 2024. If we continue to run rate this no change scenario through June 2025, it brings headline CPI-U down to just 2.3%. Obviously we cannot overstate how critical it is for OER and Rents to at least maintain their current MoM inflation rates given how concentrated CPI-U is in these two items.
Auto insurance continues its meteoric rise
Whether the next key takeaway is "good" or "bad" is in the eye of beholder. After correcting down markedly last month (on a MoM basis) auto insurance popped up again, rising 79 basis points MoM.
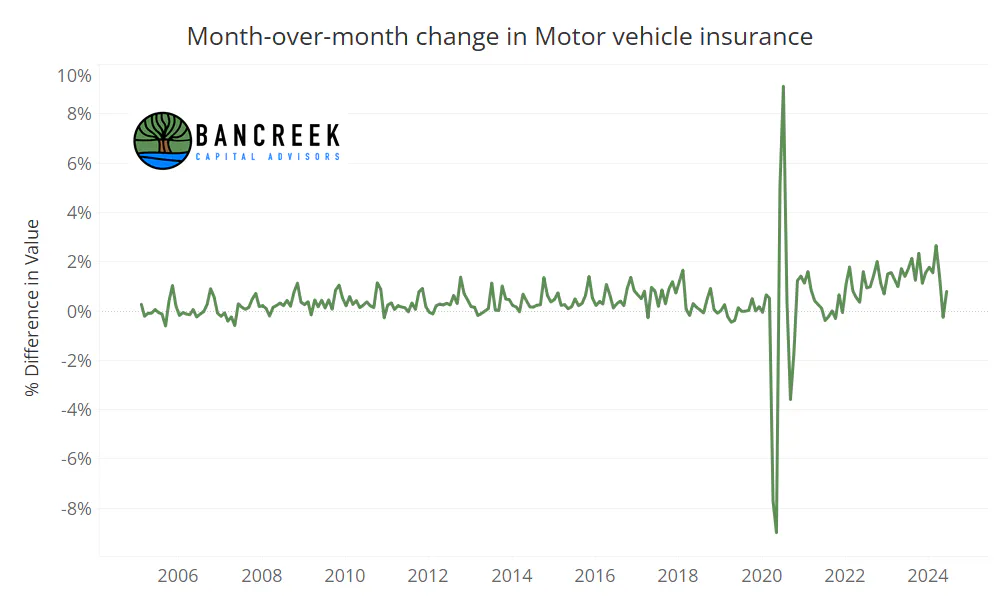
Source: Bancreek Capital Advisors, LLC
The "bad" interpretation of this is that last month's excitement that the very strange behavior in this measure had come to a screeching halt seems premature. As such, when we look at the year-over-year chart, inflation only stepped down to 19.5% from 20.3% last month.
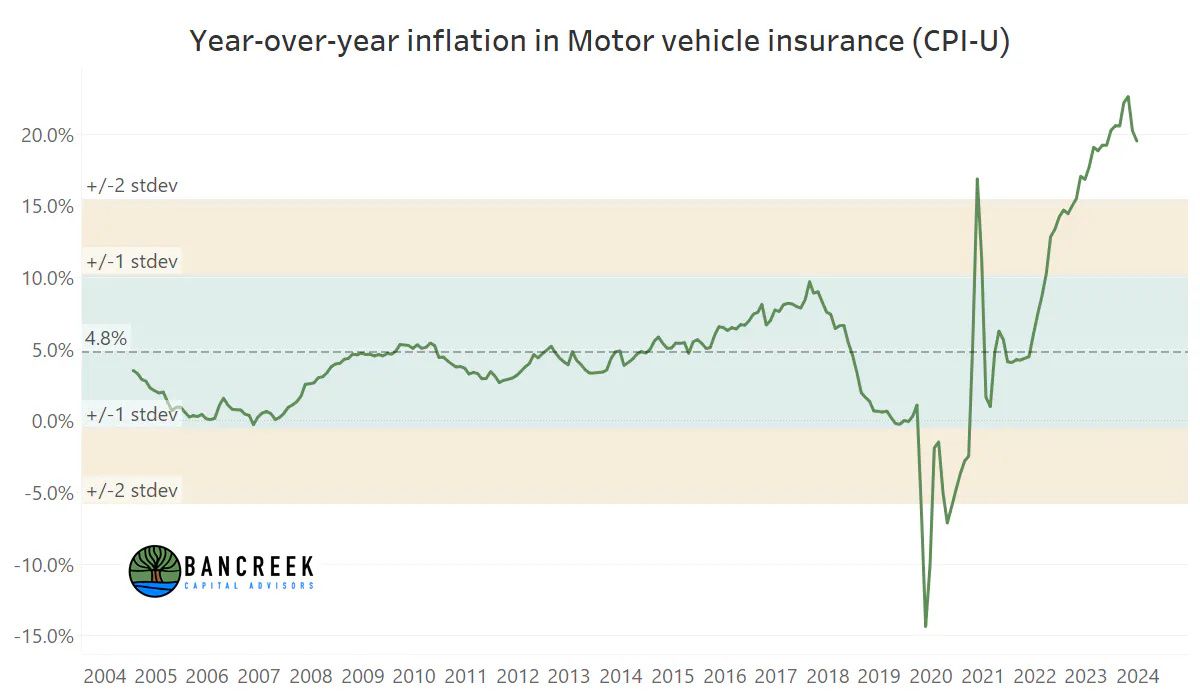
Source: Bancreek Capital Advisors, LLC
Note that had last month's MoM inflation continued into June, June's YoY print for this item would have instead been 18.3%, which is a meaningful difference given how bloated the impact of this single item is on CPI-U at the moment. To understand just how bloated it is, you can hover over the dark red motor vehicle insurance bubble in our Bancreek Inflation (CPI-U) Visualizer. Try it out! You'll quickly see it was responsible for 52 basis points of overall inflation in June. So had there been no inflation here, headline CPI-U would have been 2.5% in June.
Call us optimists, but this is where we argue you could look at the persistence of the head-scratching inflation in Motor vehicle insurance as a "good" thing. In our view, the unprecedented rise in this single metric is bound to reverse sometime. There is simply no precedent for this sort of a rise in the entire history of the data. Moreover, we are not seeing similar rates of inflation in the PCE's measure of auto insurance inflation, as shown below (and explained in more detail here).
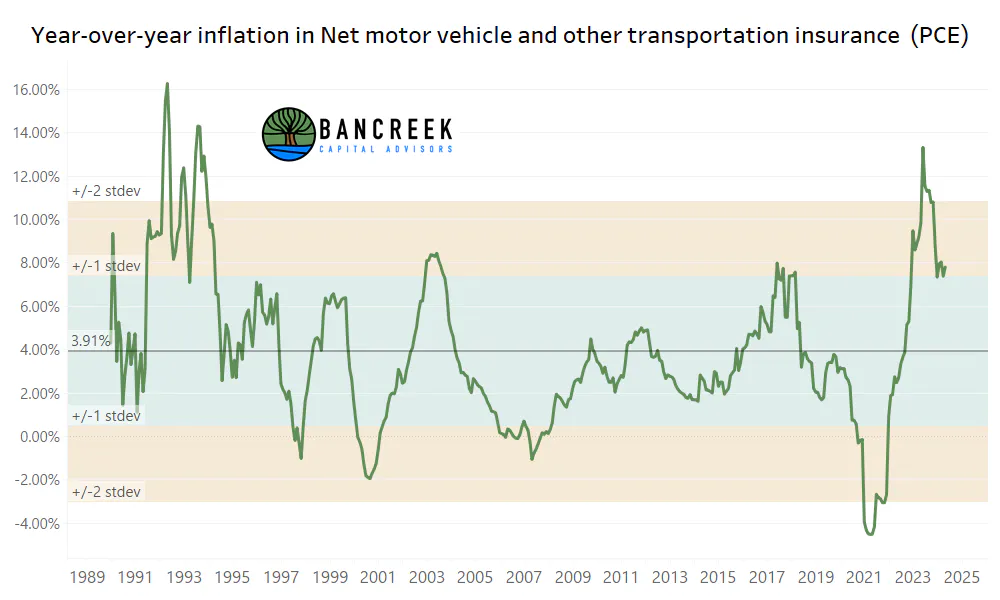
Source: Bancreek Capital Advisors, LLC
When these nightmarish prints for Motor vehicle insurance in CPI-U end is anyone's guess. Again, you can choose to look at this as a negative, which would imply that this metric, 1) actually represented reality for auto insurance and, 2) you held the view that insurers could continue to push through unprecedented rate increases forever. On the other hand, if like us, you are not convinced this metric is representative of our reality (but rather is just a metric) and have no reason to believe the madness will continue forever, it's not hard to get excited that inflation could today have 50 basis points of bloat in it which, over time, could leak out.
A near perfect CPI-U print?
When we put all the pieces together, it strikes us that June's CPI-U print couldn't have been much better for folks like us that were looking for hard evidence that CPI-U can drift down into the 2% range. The timing on such a print was fortuitous as well, as it comes on the heels of what we would consider to be a depressing non-farms payroll report in which only 54k jobs were created outside of government and health care and social assistance. If you haven't already, take a look at our Employment data treemap and see for yourselves!
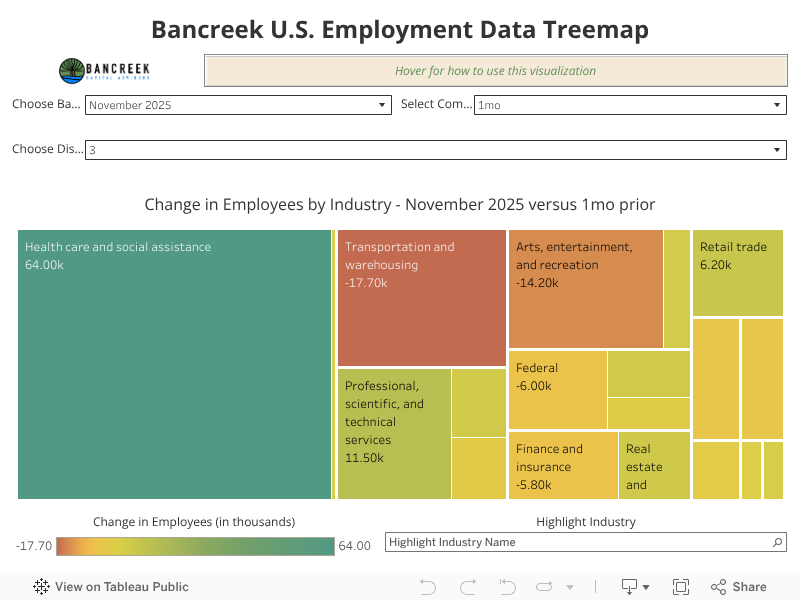
Clearly, anything can happen going forward, so it's risky to lean into just a few recent data points. That said, we'll do it anyway. These last two data points (CPI-U and nonfarm payrolls) have sent clear signals, in our view, that, 1) we finally have some hope that there is visibility to the Fed's inflation targets and, 2) outside healthcare and government, the job market is less than ideal. We'll see what the powers that be do with this information! But at the very least, know that you can at least arm yourself with the data and analysis you need to make sense of all these moving parts here at bancreek.com.
Enjoying this post?
Tell others about it.

Bancreek's Actively Managed ETFs
If you are interested in learning more about Bancreek Capital Advisors' actively managed ETFs click the link below
Learn MoreMore articles like this
Fetching Related Posts
There are no other articles tagged with Research
