
Key takeaways from the December 2024 Personal Consumption Expenditures release

Eric Pachman
Published
January 31st 2025
Eric Pachman
Published
January 31st 2025
December 2024 year-over-year PCE comes in 10 basis points higher than prior month
This morning the Bureau of Economic Analysis released December 2024 Personal Consumption Expenditures (PCE) data. Overall PCE was reported at 2.55% year-over-year (YoY) for December, up 10 basis points from 2.45% year-over-year last month. Meanwhile, core PCE inched down to 2.79% in December 2024 from 2.82% in November 2024.
Fooled by rounding?
Before we jump in to this month's (quite straightforward) breakdown of the data, let's first iron out some confusion in the numbers this month. For some odd reason, media outlets choose to report out PCE December 2024 rounded to one decimal place. As such, you may have seen a lot of reports out there that PCE rose from 2.4% in November 2024 to 2.6% in December 2024. This is true, but very misleading. If you expand these numbers out to three decimal places, you will discover that November's PCE print was actually 2.448%, which is pretty much the highest number it could be and still round down to 2.4%. Meanwhile, December's PCE print taken to three decimal places was 2.552%, pretty much as low as it could be to still round up to 2.6%! Subtract these two numbers and you'll arrive at an increase of 10.4 basis points, which is half of what the one-decimal-place media is saying it is. That's a big deal! The majority of the market is thinking PCE just rose 20 basis points MoM, when you now know it was really just 10 basis points. But that's why you read Bancreek. Apparently, sometimes getting an edge is as simple as not rounding a number.
OK, now back to our regularly scheduled programming...
As a reminder, Bancreek publishes two visualizations that can help you explore PCE in granular detail. Both of these visualizations have now been updated through December 2024 and are embedded below:


This post hopefully will further assist in your analysis of the moving parts underlying this month’s PCE print. Its goal is not to provide a comprehensive analysis of the more than 180 items we track (that’s what the visualizations are for), but rather just to point to the most meaningful changes from one month to the next.
To perform this analysis, we track a measure we call “inflation impact,” which we calculate by multiplying each item’s YoY inflation by its weight in the prior year period. You can think of this as “weighted inflation” as opposed to the “unweighted inflation” that is more commonly reported by the media. Each month we take the weighted inflation of each item we track in PCE and then sum them up to overall PCE. Then we compare these weighted inflation numbers from one month to the next to see what drove the sequential increase or decrease. In this way, we can precisely identify the most significant drivers in the change in YoY PCE from one month to the next.
Gasoline is to blame for the rise in headline PCE
We're coming up on our year anniversary of publishing our interactive inflation data visualizations. In the past year, this month's print was quite possibly the easiest one to analyze.
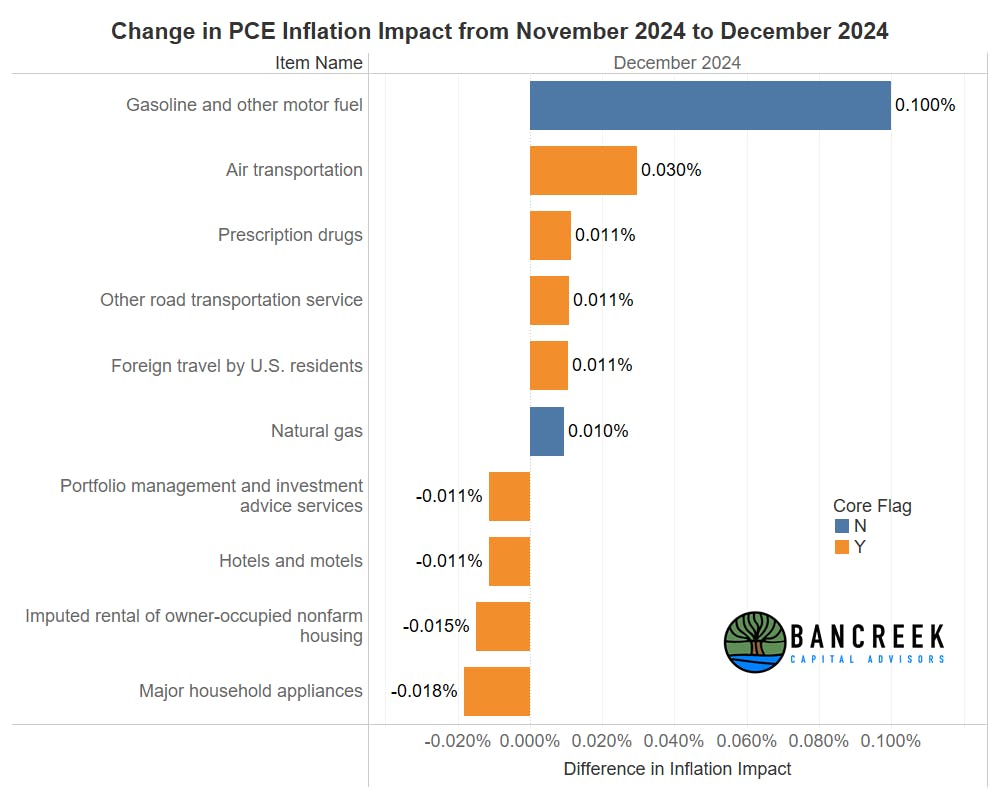
As usual, each month we create a "walk-across" chart (of sorts) with the goal of explaining how we got from last month's headline inflation print to this month's print. As mentioned in our rounding section, we have just over 10 basis points of additional inflation to explain this month, which conveniently can all be explained through lower gasoline deflation in December (-3.8%) than in November (-8.4%).
Source: Bancreek Capital Advisors, LLC
The good news here is that this isn't "news" at all. We already knew what December gasoline deflation was roughly going to be from the CPI data release earlier this month (-3.4%), and even before that, we had a good idea of what that was going to be right when December 2024 ended from the change in the AAA's Daily National Average Regular Unleaded Gasoline Prices (also -3.4%). So, we have largely known what gasoline was going to do today in PCE for about a month now.
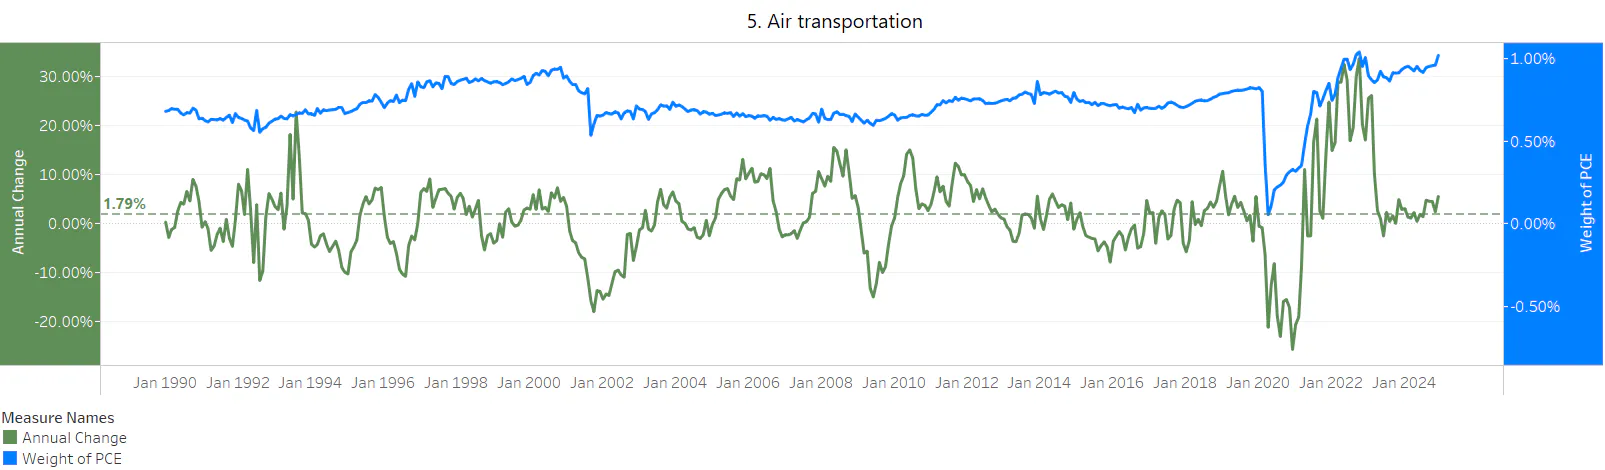
Rather the news today was that there was no other news. If you drop gasoline out of the picture, the other items with notable changes from November to December (where we define "notable" as larger than one basis point inflation impact) all netted out to just two basis points of incremental inflation. In other words, essentially nothing. Air transportation was the second largest contributor to MoM inflation (+3 bps inflation impact), which is consistent with the inflationary pressure we saw on Airline fares in the CPI report earlier this month. However, when you add some historical context to this item (as we have done below) its 5.6% YoY increase doesn't feel too troubling.
Source: Bancreek Capital Advisors, LLC
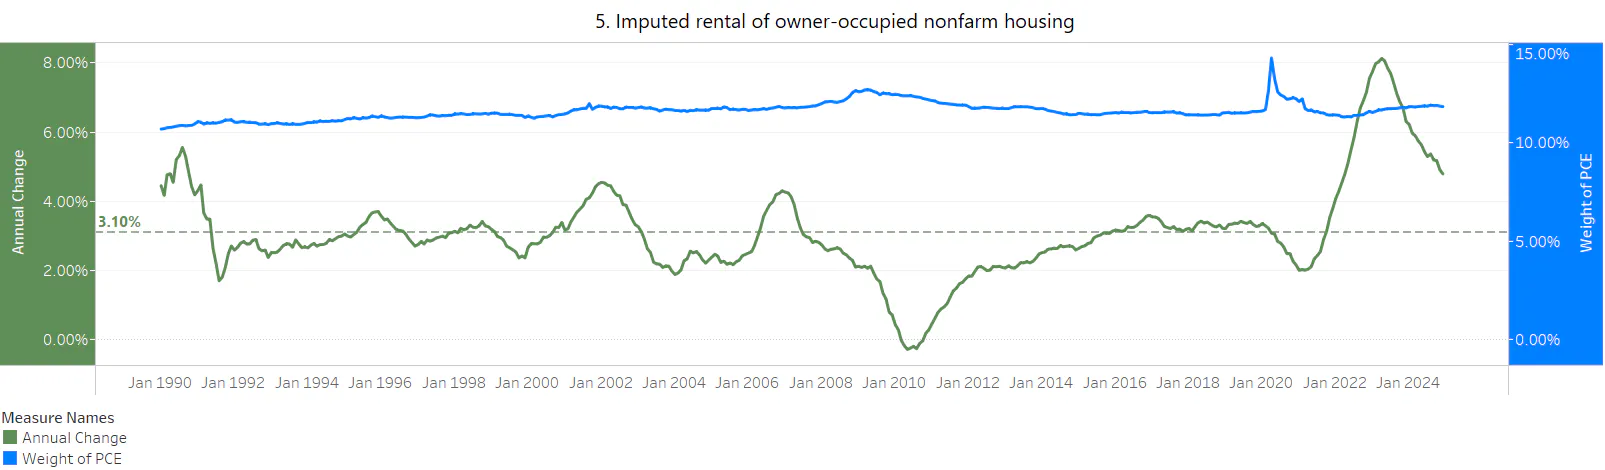
Meanwhile, on the favorable side of the ledger, we see Imputed rental of owner-occupied nonfarm housing, a.k.a. Owners equivalent rent of residences, a.k.a. "OER", a.k.a. "how much do we collectively think we would get in rent for our houses when someone calls and asks." This is the top dog of all items, carrying an 11.8% weight of all PCE (and 26.8% of CPI!). So, it's always good to see this on the favorable side of our walk-across. For reference, the following chart shows the history of this item's inflation dating back to 1990. Slowly but surely this is improving, but still has a ways to go before it makes it back to its 3.1% long-term average.
Source: Bancreek Capital Advisors, LLC
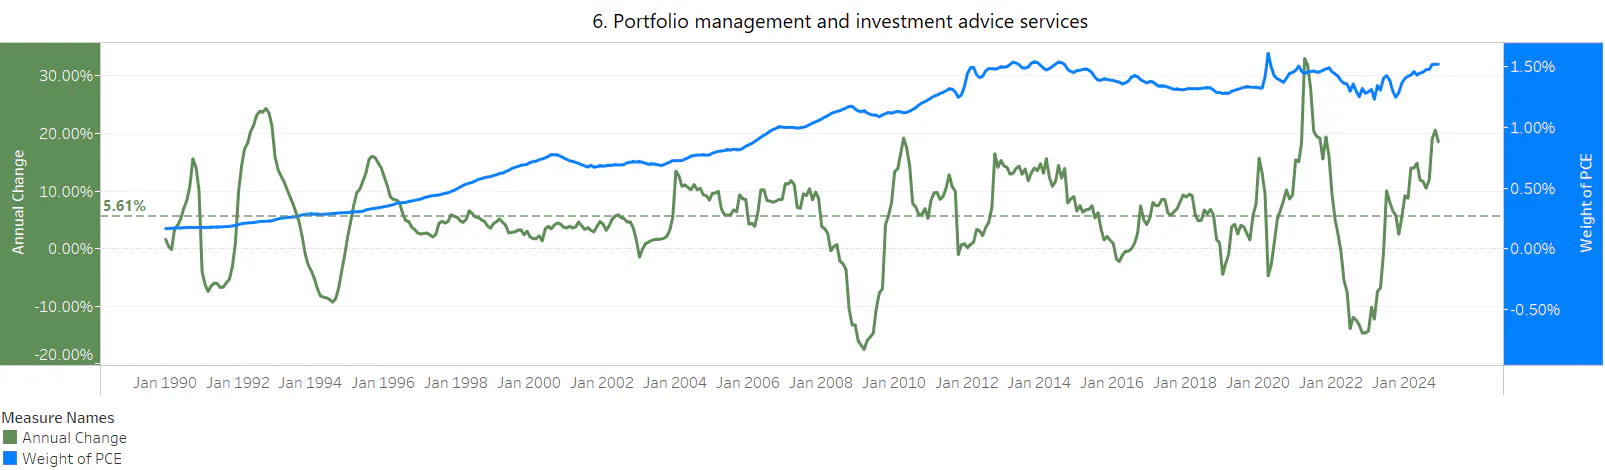
Lastly, we'll call out Portfolio management and investment advice service, which on an unweighted basis rose 18.6% YoY in December 2024 (down from 20.6% YoY in November 2024). Again, this isn't a surprise as its been widely reported that this item just trends stock market cycles. You don't have to study the following chart too closely to at least directionally confirm this, as we see large swoons and spikes closely mirroring market cycles. With the S&P 500 registering yet another 20%+ in 2024, it's no wonder this item is up 18.6% in December.
Source: Bancreek Capital Advisors, LLC
The more interesting part is how large this single item has become now. We estimate it to carry a 1.52% weight in PCE. When we apply this weight to the 18.6% YoY change, we calculate that this single market-linked item was responsible for 25 bps of inflation. We calculate that if this single item had inflated at it's historical average (5.6%) PCE would have been 2.37% in December rather than 2.55%.
What's interesting here is that this single item has become a self correcting mechanism of sorts. If the market goes up a lot, it pushes up this item, which elevates core PCE. If core PCE remains elevated, the Fed leans more hawkish, keeping rates higher. And then, as has become quite clear in recent years, equities don't tend to love higher rates. This then could push markets down, and bring down core PCE with it. Problem solved!
Of course this is an overly simplified depiction of how this works, and ignores the myriad other factors that can drive equities this way and that. But, it is interesting to note that this one factor does have this self correcting nature built into its DNA.
Year-over-year core PCE declines in December
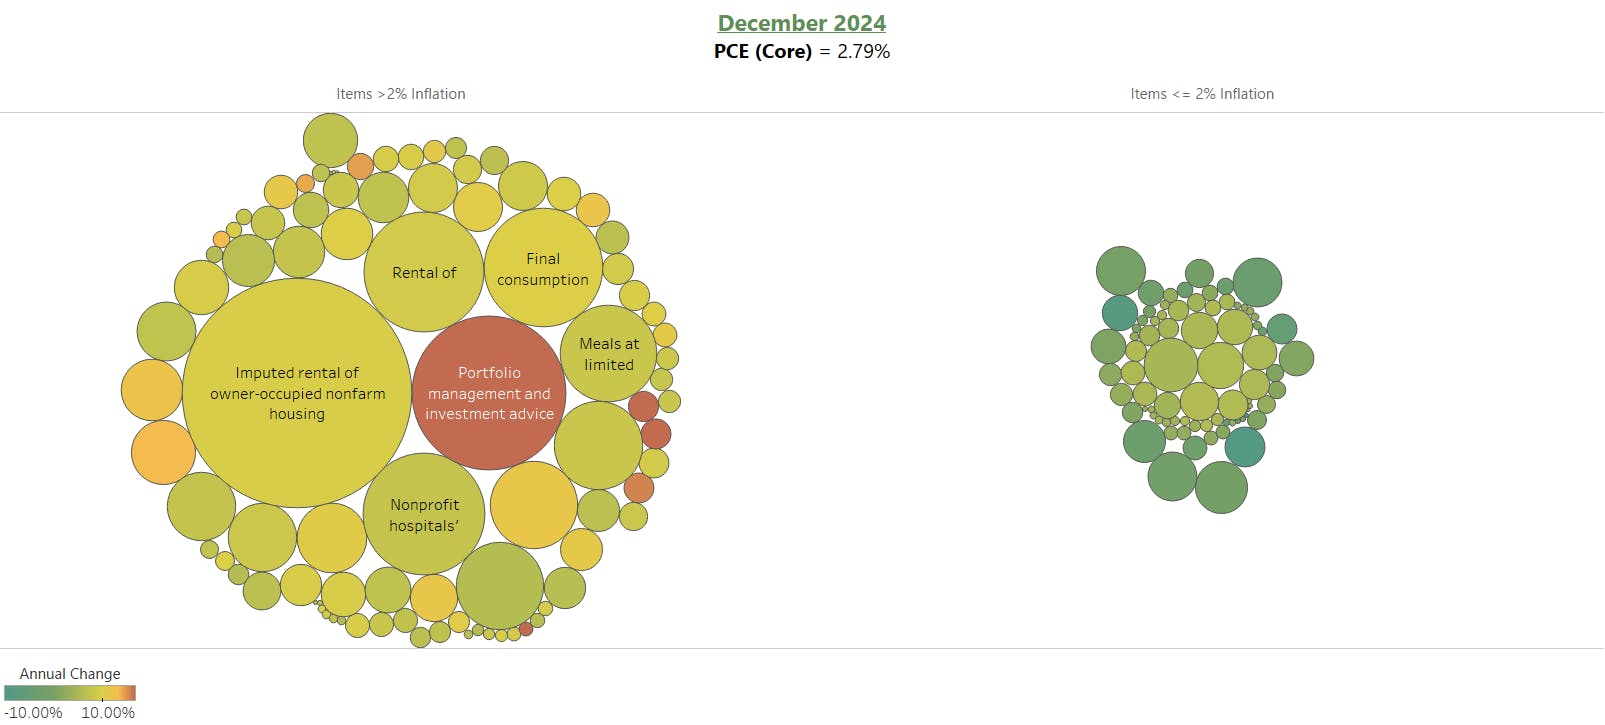
One of our early 2025 enhancements to the Bancreek Inflation (PCE) Visualizer was adding a core flag to the tool. Simply click into the dropdown box in the bottom right of the viz called "Core Inflation," select "Core," and you should see the following view:
Source: Bancreek Capital Advisors, LLC
Overall, core PCE came in at 2.79% YoY in December, down 3 bps from 2.82% in November. That's not much of a decline, but a decline nonetheless!
We encourage you to interact directly with the viz to see how this is changing from month-to-month. What you'll find is that not much has really changed since we bottomed out at 2.63% YoY core PCE in June. First, the aforementioned Portfolio management and investment advice services has surged over that period, adding 8 bps to core inflation. Then, we lost most of the deflationary benefit of Used cars and light trucks, really just as we cycled out some very high index values from the summer of 2023. Less deflation in autos and light trucks added another 8 bps to core PCE. Add up the impact of a rising stock market and stabilizing car prices on PCE and that explains the entirety of the 16 bps increase in core inflation from its nadir in June to December. All other changes to core PCE cancelled out.
Stability doesn't sell
We offer this one interpretation of the data to help cut through the noise. Lately it seems like every other headline we see is attempting to dredge up fear (or celebration) on inflation. Even Fed officials make statements that may lead us to believe that things are getting better or worse. The reality of it is that outside of a couple items (out of hundreds) not much has changed over the the last half a year. Again, the market has gone up, and auto deflation has started to cycle tougher comparisons. But a takeaway message that nothing has really changed doesn't sell well. But we're not here to sell you our research and data tools; we're just here to help you navigate this complex data set. Keep coming back and consider joining our distribution list if you'd rather study and learn than be sold and told.
Enjoying this post?
Tell others about it.

Bancreek's Actively Managed ETFs
If you are interested in learning more about Bancreek Capital Advisors' actively managed ETFs click the link below
Learn MoreMore articles like this
Fetching Related Posts
There are no other articles tagged with Research
