
February 2025 PCE report: Broad-based inflationary pressure

Eric Pachman
Published
March 31st 2025
Eric Pachman
Published
March 31st 2025
February 2025 year-over-year PCE remains stable at 2.5%, but core rises to 2.8%
Last Friday, the Bureau of Economic Analysis released the February 2025 PCE inflation report. Overall PCE was reported at 2.54% year-over-year (YoY) for February, up two basis points from 2.52% (revised) year-over-year last month. More notably, core PCE increased to 2.79% in February 2025 from 2.66% (revised) in January 2025.
As a reminder, Bancreek publishes two visualizations that can help you explore PCE in granular detail. Both of these visualizations have now been updated through February 2025 and are embedded below:


This post hopefully will further assist in your analysis of the moving parts underlying this month’s PCE report. Its goal is not to provide a comprehensive analysis of the more than 180 items we track (that’s what the visualizations are for), but rather just to point to the most meaningful changes from one month to the next.
To perform this analysis, we track a measure we call “inflation impact,” which we calculate by multiplying each item’s YoY inflation by its weight in the prior year period. You can think of this as “weighted inflation” as opposed to the “unweighted inflation” that is more commonly reported by the media. Each month we take the weighted inflation of each item we track in PCE and then sum them up to overall PCE. Then we compare these weighted inflation numbers from one month to the next to see what drove the sequential increase or decrease. In this way, we can precisely identify the most significant drivers in the change in YoY PCE from one month to the next.
Broad-based core inflation
You may recall in last month's PCE inflation report we highlighted that there was "broad-based core disinflation." Fast forward one month and the story has reversed, with the key takeaway being broad-based inflation in February 2025.
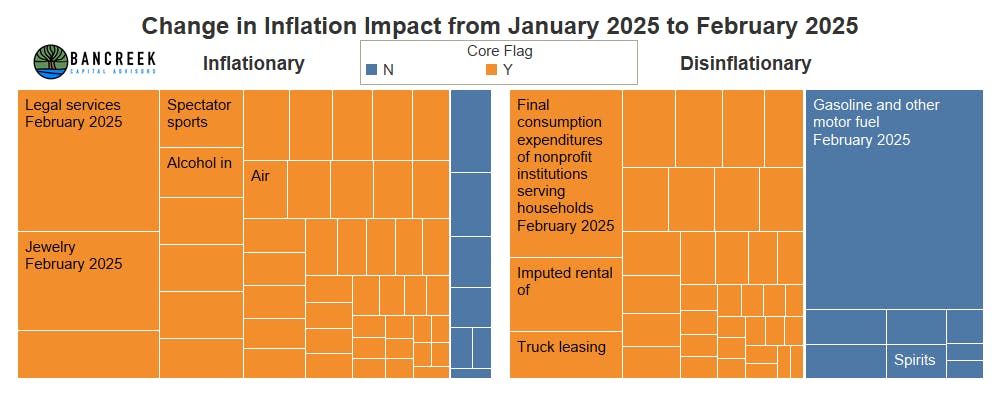
Last month we introduced a new chart to help add visual context to the breadth of the disinflationary impact. Here is the same chart with the latest month's data. Note that the left side shows the items with an inflationary impact > 0.1 bps, while the right side shows items with a disinflationary impact < 0.1 bps. The size of the box corresponds to the absolute value of the inflation/disinflation impact. Lastly, as the legend shows, orange boxes are core items while blue boxes are food and energy items.
Source: Bancreek Capital Advisors, LLC
If you spent a few seconds studying this chart, you may notice there appears to be more orange items on the inflationary side than on the deflationary side, which would make sense given we already told you the conclusion in this section's headline. But let's put some numbers to this. When compared to January, in February there were:
- 48 core items with an inflationary impact > 0.1 bps, which together added 31 bps to inflation
- 37 core items with a disinflationary impact < -0.1 bps, which together added to 20 bps disinflation
So, that's a net 11 bps of additional YoY inflation in February compared to January, which explains the majority of the 13 bps increase reported by the BEA.
It's worth noting that when look at only the items with a larger change in inflation (+/- 1 bps) we get a net inflation impact of just four bps. In other words, the net impact of the "big movers" (e.g., legal services) only explains a fraction of the overall change in YoY core inflation from January to February. This is why we had to drill deeper into the data to arrive at the conclusion that the core increase is broad-based.
Looking for more? That's what the viz is for.
We're going to keep today's post short and sweet, as we don't see much need to paste in the trend charts for each one of the small inflationary and disinflationary items since you can access all those charts using our data visualizations.
To be sure, there are some interesting charts this month. One that is quite strange, in our view, is the Legal services chart, which has frenetically flip flopped back and forth over the past two years or so, after nearly 20 years of relative stability. We have no idea what's behind this recent measurement volatility. All we know is that this month this single item added five bps to inflation. If you don't think that's a big deal, consider that without this one item core PCE would have rounded down to 2.7% YoY, in line with consensus.
Again, if you are looking to arm yourself with more detail on the 180+ items, please consider using our free PCE reports & data visualizations. They are both embedded at the top of this post, and are available here and here.
As always, thanks for reading and interacting. See you on Friday for our coverage of the other side of the Fed's dual mandate: jobs data.
Let's discuss on socials! You can find us on LinkedIn and X. We truly look forward to hearing from you!
Enjoying this post?
Tell others about it.

Bancreek's Actively Managed ETFs
If you are interested in learning more about Bancreek Capital Advisors' actively managed ETFs click the link below
Learn MoreMore articles like this
Fetching Related Posts
There are no other articles tagged with Research
