
Key takeaways from the February 2025 Consumer Price Index release

Eric Pachman
Published
March 12th 2025
Eric Pachman
Published
March 12th 2025
February 2025 year-over-year inflation (CPI) eases to 2.82%
This morning the Bureau of Labor Statistics released the February 2025 US Consumer Price Index (US CPI) for All Urban Consumers (CPI-U). Overall CPI-U was reported at 2.82% year-over-year (YoY) for February, down 18 basis points from 3.00% YoY last month.
As a reminder, Bancreek publishes two visualizations that can help you explore CPI-U in granular detail. Both of these visualizations have now been updated through February and are embedded below:
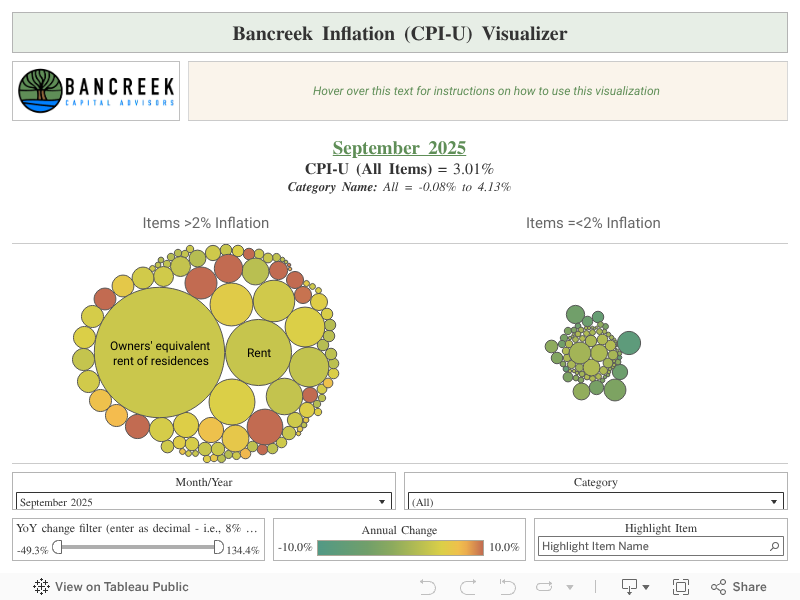
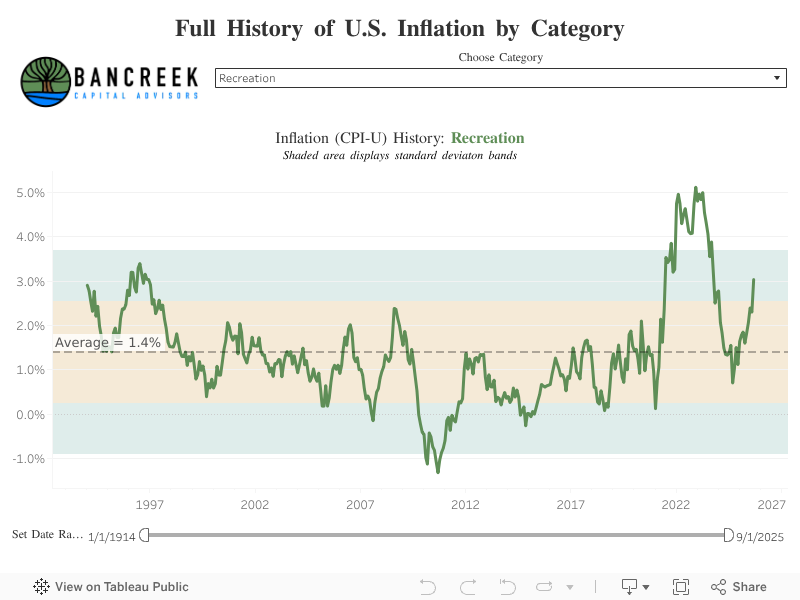
This post hopefully will further assist in your analysis of the moving parts underlying this month’s US Consumer Price Index (US CPI) report. Its goal is not to provide a comprehensive analysis of the nearly 180 items we track (that’s what the visualizations are for), but rather just to point to the most meaningful changes from one month to the next.
To perform this analysis, we track a measure we call “inflation impact,” which we calculate by multiplying each item’s YoY inflation by its weight in the prior year period. You can think of this as “weighted inflation” as opposed to the “unweighted inflation” that is more commonly reported by the media. Each month we take the weighted inflation of each item we track in CPI-U and then sum them up to overall CPI-U. Then we compare these weighted inflation numbers from one month to the next to see what drove the sequential increase or decrease. In this way, we can precisely identify the most significant drivers in the change in YoY CPI-U from one month to the next.
The items that changed the most this month conveniently explain the entire change in headline inflation
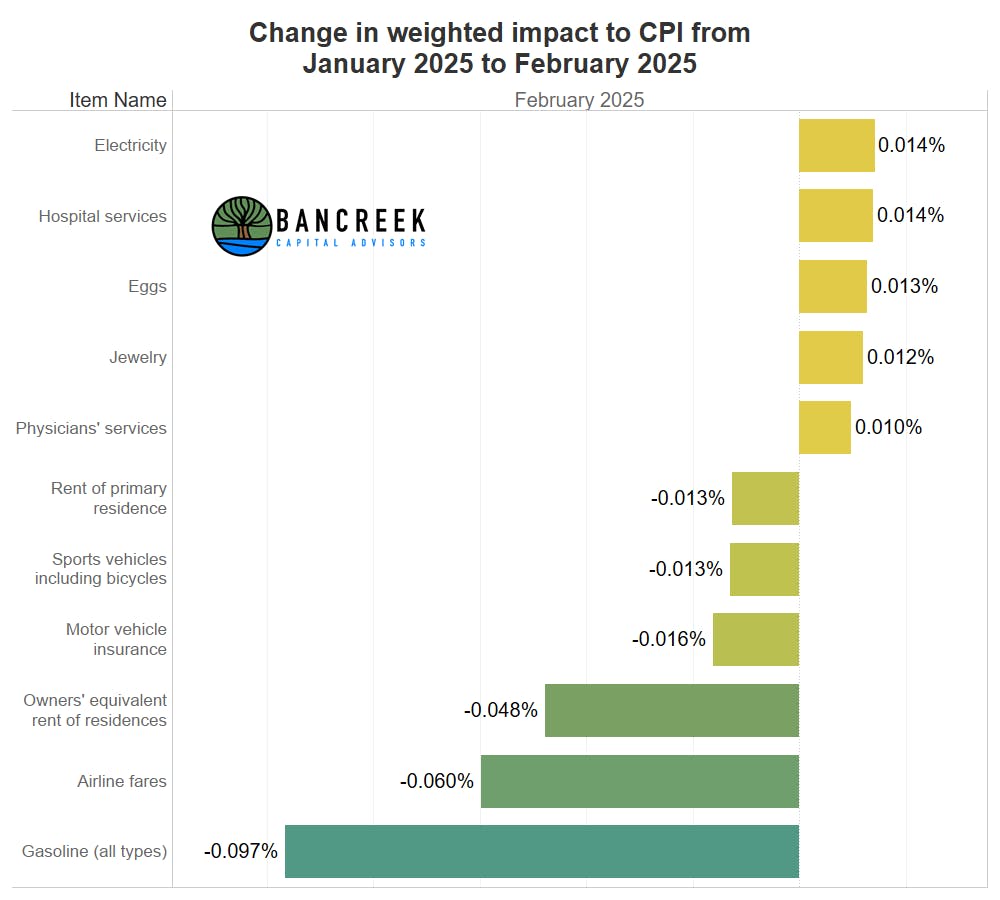
As a reminder, our primary goal with our analysis each month is to explain the main drivers responsible for the change in CPI from the prior month to the current month. To that end, we have 18 basis points of lower YoY inflation in February when compared to January to explain. The following chart shows 11 items whose weighted inflation impact on US Consumer Price Index changed by +/-1 basis point. Conveniently for all of us, when we sum up the inflation impact of these 11 items we get -18 bps. In other words, any small changes in weighted inflation on the other 165+ items all netted out to zero.
Source: Bancreek Capital Analysis, LLC
Given how cooperative the data was this month, we can just use the above chart as a table of contents of sorts to walk you through a few of the main drivers of the decline in CPI this month.
Gasoline prices continue to ease
Let's start with the most favorable development this month, which was once again, gasoline price deflation. According to the BLS, gasoline prices dropped -3.1% YoY in February. As we've written, the BLS' numbers are almost perfectly correlated with Daily National Average Gasoline Prices (Regular Unleaded) as measured and reported daily by AAA. So, going into today's print AAA already had told us prices were down -2.9% YoY. As such, today's -3.1% print shouldn't have come as a surprise to anyone. If this almost perfect correction between these two series is news to you and you are looking for a more complete discussion on the relationship, check out this post.
This almost perfect correlation between Gasoline in CPI and AAA's reported prices unlocks our ability (and yours) to look into the future to see what Gasoline's impact could be on CPI next month. So, let's go ahead and do that now.
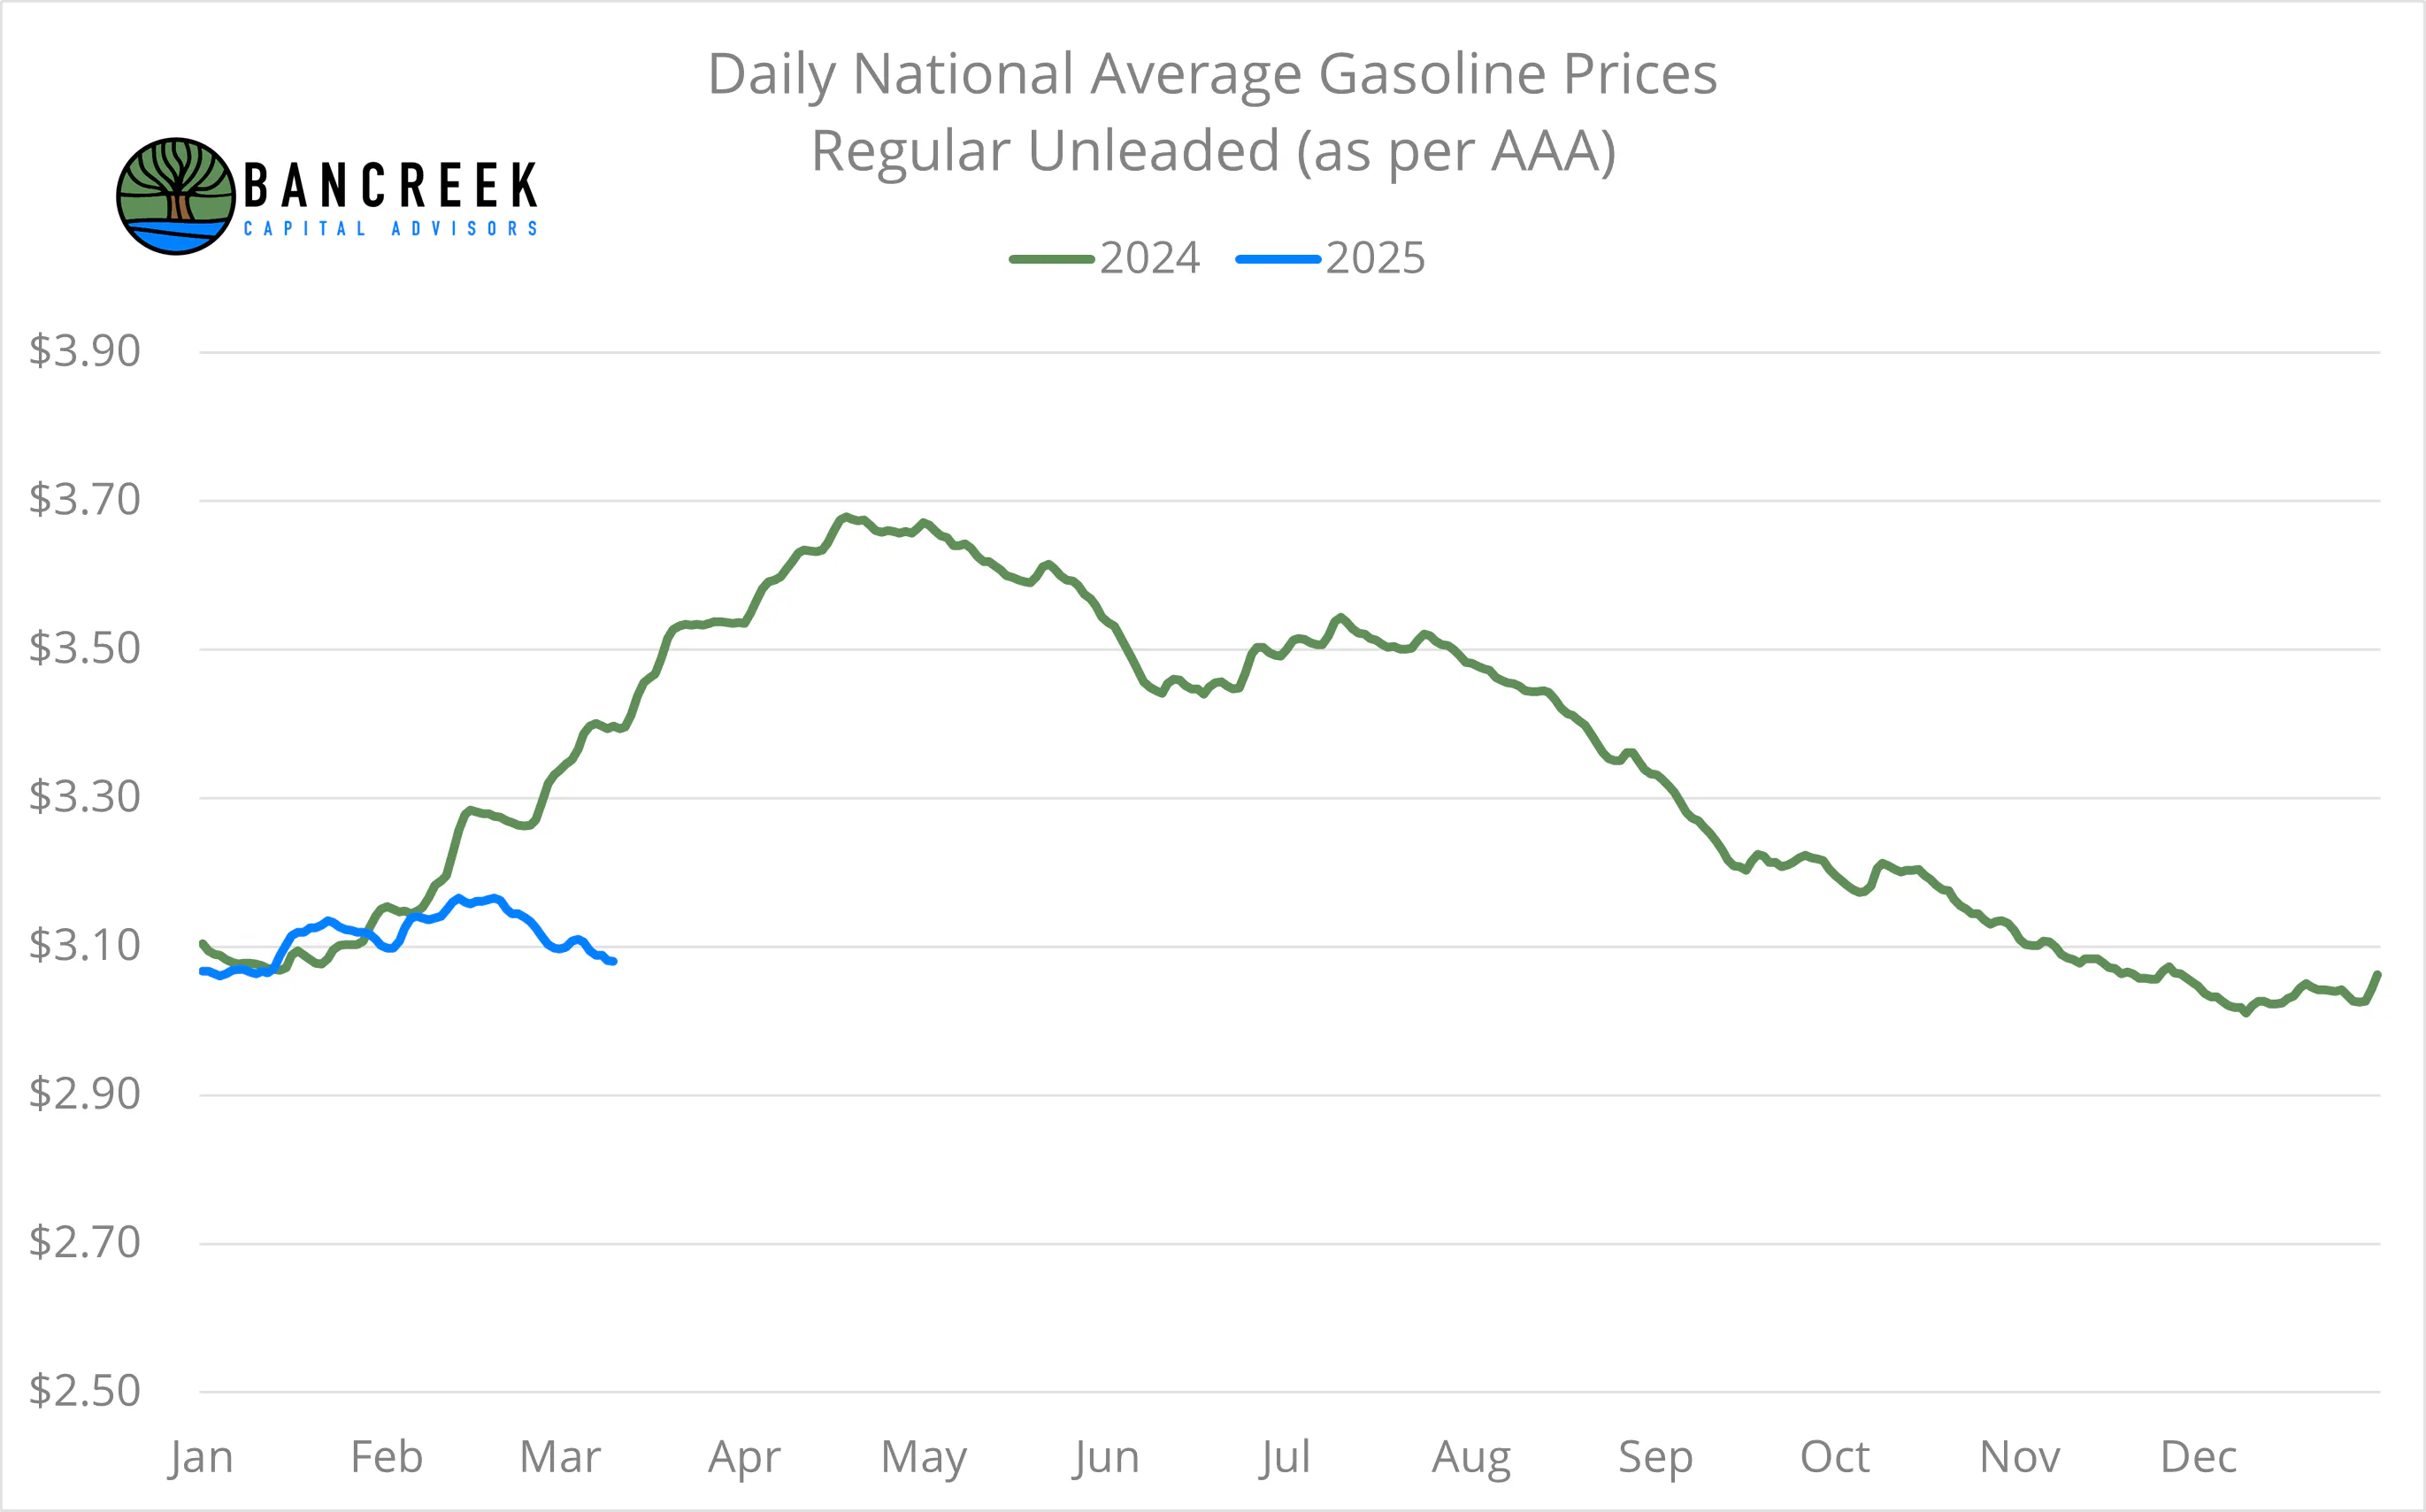
Through 3/11/25, the average price of gasoline in March was $3.10 per gallon. That's just slightly down from $3.14 per gallon in February. But, what we really care about here is the YoY comparison. Note that we usually see some seasonal uplift in gasoline prices going into the spring. As shown in the chart below, this dynamic played out last year with gasoline prices rising through the month, ultimately exiting the month north of $3.50 per gallon. With a third of the month in the books this year, that hasn't started to happen yet. Let's say gasoline prices ignore their normal seasonality in 2025 and stay at $3.10 per gallon this March. If this happens, we would end up with -10.5% deflation in this item in March. If we apply Gasoline's weight to this, this would chop a whopping 25 basis points off headline inflation alone. This is a huge number, as it alone could bring headline CPI down from 2.82% to 2.57%.
Source: Bancreek Capital Analysis, LLC
What's clear from the above chart is that this story is not just about March. If we don't get the seasonal rise in gasoline prices this year, Gasoline will be heavily deflationary to CPI all the way through the summer. But, of course there are two problems with getting excited about this at the moment. First, gasoline prices are notoriously volatile, meaning there is no point in looking forward any further than March at this time. Second, we should maybe ask ourselves if the lack of a seasonal increase in gasoline prices is possibly a symptom of a bigger problem. While we're not going to dive into the supply/demand dynamics of gasoline in this post, if this uncertainty is keeping you up at night, we'd urge you to figure out whether muted prices are driven by higher supply or by fewer folks driving into the spring (i.e., lower demand). If it's the latter, well... that one piece of data pointing to a weaker consumer.
A fantastic month for shelter inflation
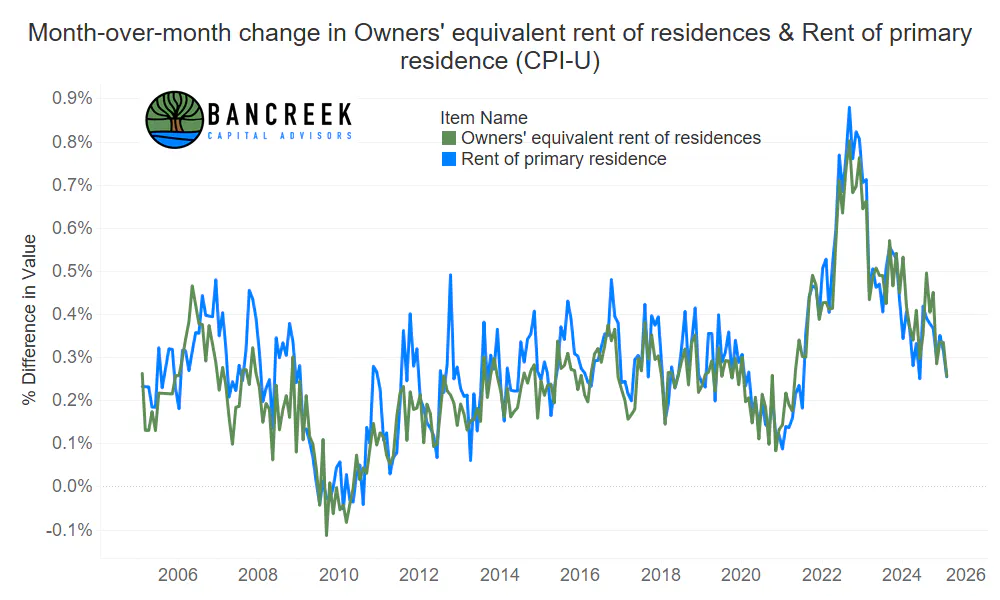
While gasoline was the biggest numerical takeaway from today's data, shelter was the true star of today's data show. As shown below, both Owners equivalent rent of residences ("OER") and Rent of primary residences ("Rent") put up MoM inflation of just 0.26%. That's the best combined print we've seen since shelter inflation took off in 2022!
Source: Bancreek Capital Analysis, LLC
This more normal MoM inflation for OER and Rent rate helped ease YoY inflation to 4.4% and 4.1%, respectively. Note that if these two absolutely critical (due to their combined size) items can hold this 0.26% MoM inflation rate, that annualizes to 3.2% YoY inflation. Of course, this is still a big IF... but our goal here is to quantify these sensitivities for you to help you think about CPI going forward. With that in mind, if both OER and Rent drop to a 3.2% annualized rate, that would shave another 40 basis points off headline CPI. This is a huge number. But then again, OER and Rent together comprise 34% of headline CPI, so we shouldn't be surprised that shaving an entire point off inflation for these two items would drive such a large disinflationary move in CPI.
Airline fares turn deflationary in February
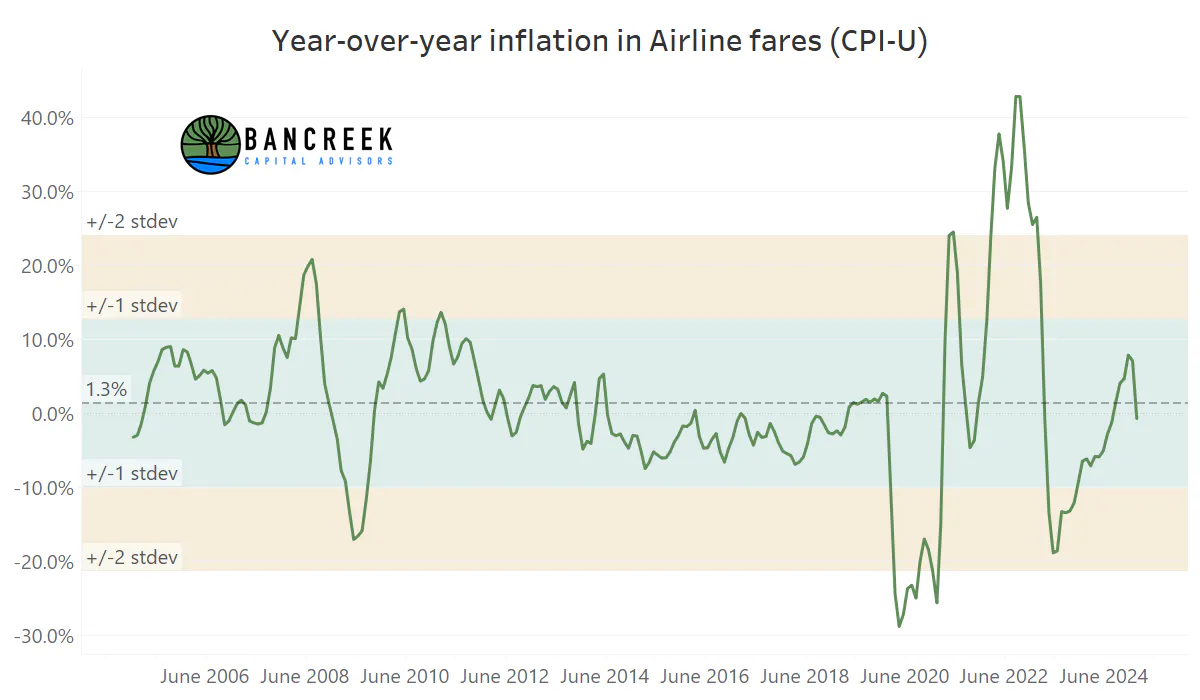
We're normally not keen on writing about Airline fares simply because they are insanely volatile on a month-to-month basis. To put numbers to this, as shown below, average Airline fare inflation dating back to 2005 has been 1.3%. While that number shouldn't raise any eyebrows, the 11.4% standard deviation in the series certainly should! This means that Airline fare inflation could come in anywhere between -10.0% YoY and +12.7% YoY and that would just be normal.
Source: Bancreek Capital Analysis, LLC
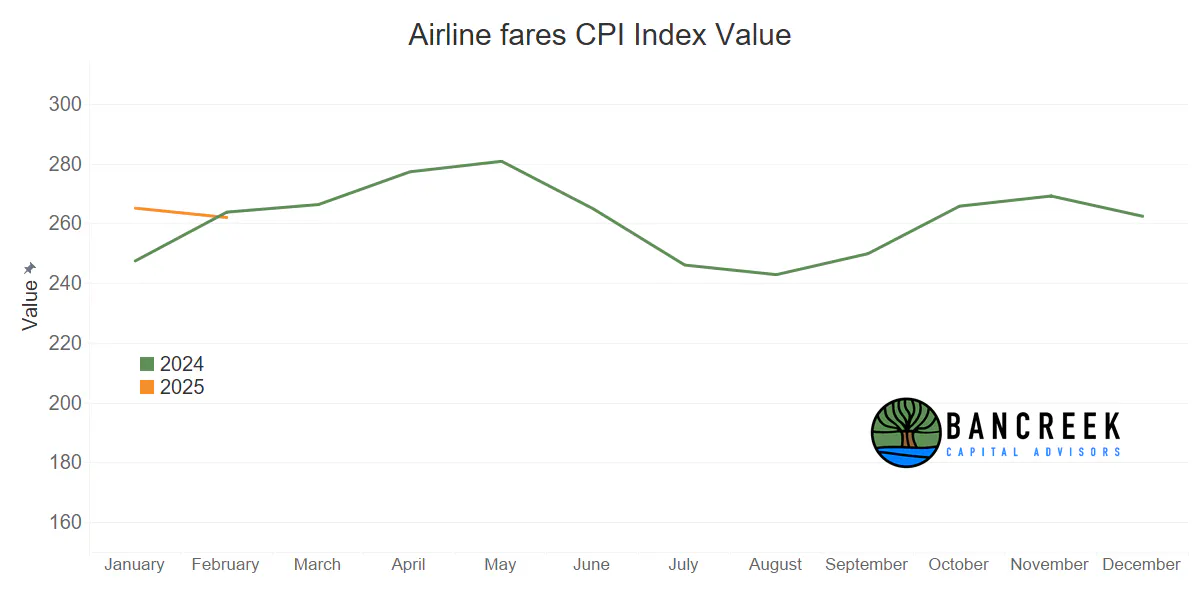
That said, the swing in Airline fares from +7.1% inflation last month to -0.7% deflation this month chopped a whopping six basis points off headline inflation. As shown earlier, this was the second most favorable item behind Gasoline.
So, we'll thank Airline fares for the favorable print this month and move on. Unlike gasoline and shelter, we don't think it makes sense to do any math around what this could mean going forward given the randomly volatile nature of this item. Having said that, airlines have been very publicly talking about their struggles with consumer demand in recent weeks. If this were to continue, we could get more favorable prints from this item as comparisons get easier through May. Although, as is the case with gasoline prices, while this may be good for inflation, it's not so good for our assessment of the U.S. economy.
Source: Bancreek Capital Analysis, LLC
Motor vehicle insurance inflation less egregious in February
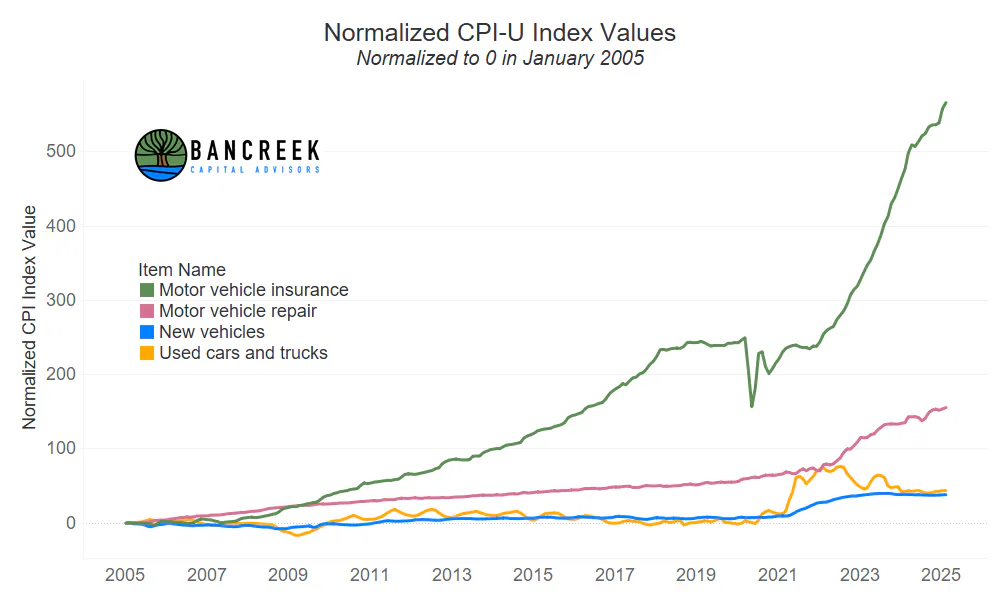
Last but certainly not least, let's take a look at CPI's mortal enemy, Motor vehicle insurance. Just to level set here for new Bancreek readers, this relatively small item (2.85% weight in CPI) currently has a 0.317% inflation impact. In other words, you can thank Motor vehicle insurance for 32 basis points of this month's 2.82% headline inflation. To be fair, this has come down a lot from over 50 basis points last summer. But it's still just way out of line with where this item has been historically. Here we are five years post COVID still looking at greater than 11% YoY inflation for Motor vehicle insurance, more than double its historical rate of inflation (5.5% average dating back to 2005). Motor vehicle insurance is still rising double-digits despite stalling new and used car prices, which maybe we could have initially blamed for the rise in insurance rates. The following chart really puts what has gone down in perspective. Be warned, this chart may induce spontaneous fits of road rage.
Source: Bancreek Capital Analysis, LLC
But let's look on the bright side. This month, Motor vehicle insurance's MoM inflation dropped to only 0.94%, from 2.21% last month.
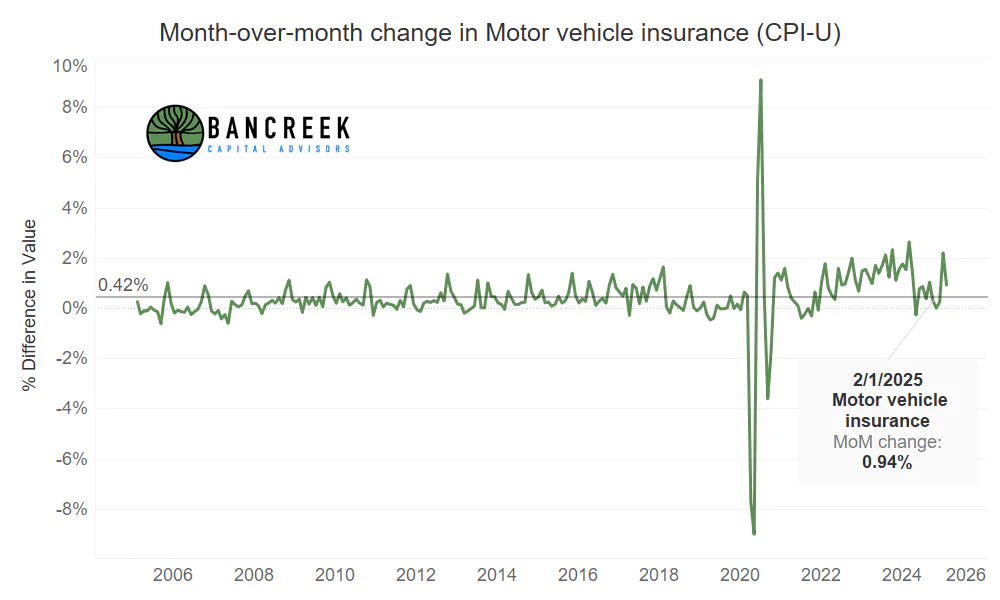
Source: Bancreek Capital Analysis, LLC
Note that 0.94% still annualizes to 11.8%, so this is not really a win given that we are currently at 11.1% YoY. We won't mince words... this item absolutely needs to come down to a more normal rate of inflation for the Fed to sustainably hit it's target (at least on CPI). The longer this astounding run of inflation lasts, the larger this item gets within CPI and the bigger the problem gets.
But take another glance at the rage-inducing first chart in this section. Why is Motor vehicle inflation still inflating at 11% without any logical drivers behind the increase? It's floating to the stratosphere on its own now, long past the time which the data suggests it should have reverted to the mean. As such, absent any intervention here, we no longer believe it makes sense to hold any hope that this item will be a major source of disinflation anytime soon. Maybe it still happens, but at this stage, we'll set our expectations super low and be pleasantly surprised if normalcy ever returns to inflation on this CPI item.
Conclusion: There is more to the inflation story than tariffs
Despite closing this report on Motor vehicle insurance, our assessment of the print was very favorable. We got the best shelter print in years, have some hope that gasoline can cleave off a large chunk of headline inflation next month, and at least don't have to report another 2%+ MoM inflation print in Motor vehicle insurance.
Of course, this all ignores any impact of tariffs, which could be so disruptive that they render any CPI forecast worthless. As such, the point of this post is not to tell you inflation is coming down because of gasoline and shelter. This could all get washed out by the impact of tariffs on other items. Rather, the point of the post is to provide you with a more nuanced and balanced way of thinking about inflation going forward. The media likes to paint things as black and white. As such, the inflation debate is now largely focused on upside risk due to tariffs. There is truth here for sure, but this post will hopefully arm you with the rest of the data you need to paint the full inflation picture, which is that shelter and gasoline can take meaningful bites out of inflation on their own. In our view, ignoring these downside risks to CPI may be just as dangerous as ignoring the upside risks due to tariffs.
As always, thanks for reading! We hope this analysis and our interactive data visualizations are useful in making sense of this wild and unpredictable macroeconomic landscape.
Enjoying this post?
Tell others about it.

Bancreek's Actively Managed ETFs
If you are interested in learning more about Bancreek Capital Advisors' actively managed ETFs click the link below
Learn MoreMore articles like this
Fetching Related Posts
There are no other articles tagged with Research
