From Coin Flips to Conviction: How Data Science Shapes Better Investing

Andrew Skatoff
Published
November 7th 2025
Andrew Skatoff
Published
November 7th 2025
Over the past two years, we’ve written at length about how data can help us assess trends in inflation, employment, and other key indicators as we take the temperature of the economy. Recently, we’ve had more conversations with investors interested in learning how data science shapes our investment process, complementing the macro insights we often share.
It’s a question we love to answer, because it speaks directly to the heart of what Bancreek was founded to do: invest.
While macroeconomic datasets from sources like BLS and ADP provide valuable insight into the broader economy, the universe of data within public markets and individual securities is far richer. Access to, and analysis of, this data is why we founded Bancreek nearly half a decade ago, and it remains central to how we identify, evaluate, and own exceptional businesses today.
At Bancreek, we invest using a systematic, data-driven approach built on the core principles of data science: observation, measurement, and continuous refinement. These tenets help us separate signal from noise, uncover structural advantages, and ultimately compound capital with discipline and conviction.
So how do we employ data science to improve investment decisions at Bancreek? As you know, we love our analogies at Bancreek, so let’s start this discussion with one of our favorites.
The Casino Analogy
Imagine walking into the largest casino in the world, filled with thousands of table games. Each game is different, with its own odds and payouts for winners and losers. Which game do you choose? How much do you bet? And what if none of the rules, odds, or payouts are posted anywhere? How would you proceed?

This is where data science and statistics, specifically, become invaluable. Like any scientific process, you begin by observing. Not casually, but carefully and in volume.
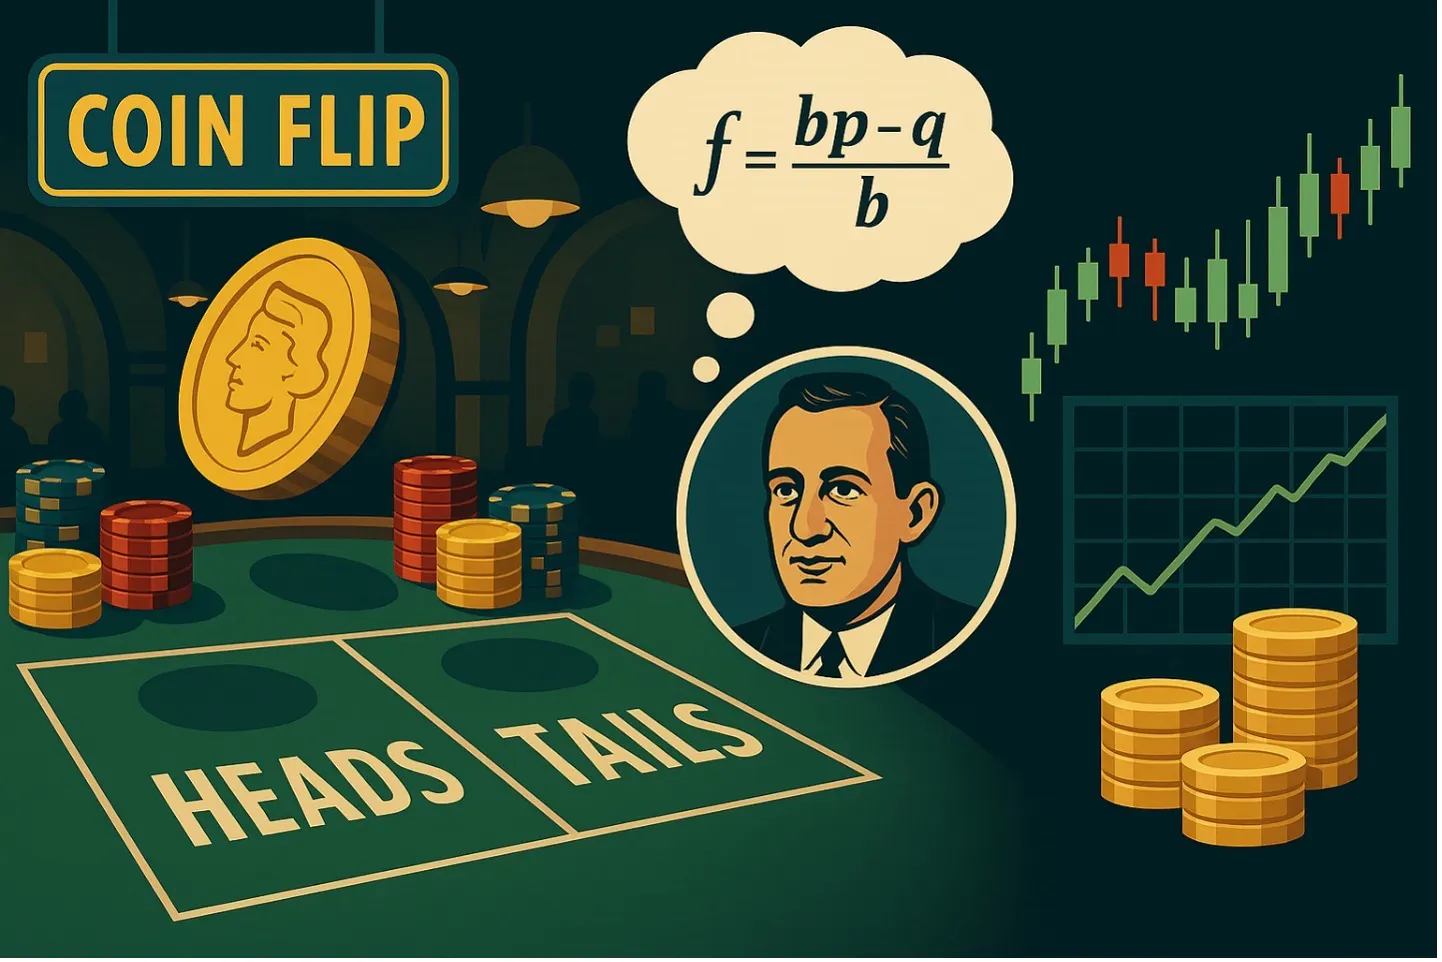
Case in point: as you enter the casino, a bright neon yellow sign above a table reads “COIN FLIP.” You walk over and watch players bet on whether the next flip of a giant coin will land on Heads or Tails.
Each player places chips on either the Heads or Tails section of the felt table. If they guess correctly, the casino pays them. If they guess incorrectly, their chips are forfeited to the house. It seems simple enough, right?
But without posted rules or visible odds, how do you know the expected payout of this game? You observe, and you keep observing.
Let’s say you notice that players are betting in $10 increments. One player places a $10 chip on Heads. The dealer flips the coin, it lands on Heads, and the player receives $10. On the next flip, the same player bets $10 on Tails. The dealer flips again, it lands on Heads, and the player loses $10 to the casino. This gives us the basic rules and payout structure of the game. But what are the actual chances of winning?
At this point, let’s step back from the casino floor and put on our data science hats. As investors, we have all stood at a table like this in one form or another, trying to make sense of patterns that may or may not be real. From here, we will look at the game through our Bancreek lens, using data to separate randomness from signal.
A Quick Refresher on Coin Flip Probability
Let’s start with the basics, assuming a perfectly fair, evenly weighted coin:
- Each flip of the coin is independent and has a 50 percent probability of landing on Heads.
- As you flip more frequently, two things happen:
- The chances of prolonged streaks go down as the number of flips increases.
- Over longer periods of time, the number of Heads and Tails should converge toward being equal.
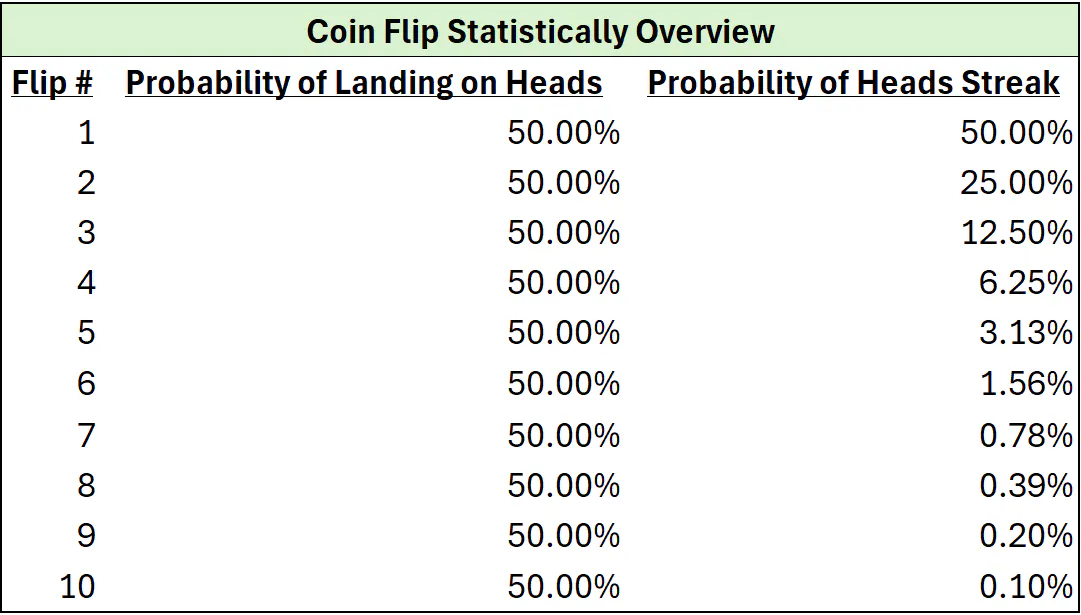
However, this doesn’t mean prolonged streaks cannot happen. Randomness can still mislead us, especially when we observe small sample sizes.
For instance, returning to our Coin Flip table game, imagine watching just three flips before deciding whether the game is worth playing. The probability of all three flips landing on Heads is about 12.5 percent, which is not unusual. If you saw that in real time, you might conclude the coin was biased toward Heads. That belief could easily influence your behavior. Arriving at the table with $100, you might decide to bet a large portion of your bankroll, convinced that the “pattern” will continue.
How much observation is enough?
This brings us to a critical question: how long should we observe the game? Another way to put it is, how much data should we collect to build enough confidence, or in investing parlance, conviction, before deciding whether to place a bet or walk away to find another table?
In the case of the coin flip game, we can simulate the results using Excel’s random number generator function. The table below shows how the observed rate of Heads changes as we increase the number of flips. Ten flips is clearly not enough, and even one hundred can give a false sense of confidence. Even after one hundred thousand flips, the results still do not perfectly reflect a 50/50 split, but they come very close.
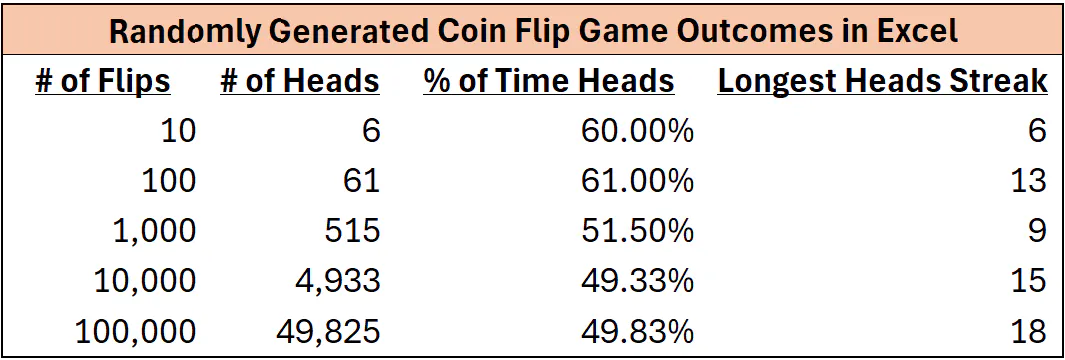
What is more interesting, and perhaps more relevant to investors, is the occurrence of streaks. In our simulation of 100,000 flips, we observed a streak of 18 consecutive Heads. Imagine if you happened to walk up to the table during those 18 flips and saw nothing else. You would likely think you found a sure thing and be ready to bet the farm on the next flip, in what is, of course, a 50% probability event, otherwise known as a coin flip (pun intended).
As data scientists, we resist that temptation. We view the entire data sequence as a whole before drawing conclusions or taking action. In this case, that means recognizing that even with the 18-flip Heads streak, the overall “hit rate” for Heads was still only 49.83 percent. The streak does not invalidate the underlying probability; it simply illustrates how randomness can distort perception in small samples.
At Bancreek, we focus on investing only where we see a true edge. So how do we determine whether an edge exists, and how much to bet or invest when we find one? For that, we turn again to data science. This time, we draw on a lesser-known concept from information theory that elegantly links probability, risk, and compounding: the Kelly Formula.
What is the Kelly Formula?
Derived by John L. Kelly at Bell Labs in the 1950s, building on the work of Claude Shannon’s groundbreaking 1948 paper “A Mathematical Theory of Communication” (the initial framework for the field of Information Theory), the Kelly Formula (or Kelly Criterion) provides a mathematical expression for determining the optimal size of a bet or investment when you know certain statistical inputs, such as the probability of winning or losing and the payout ratio.
Written out, the Kelly Formula is:
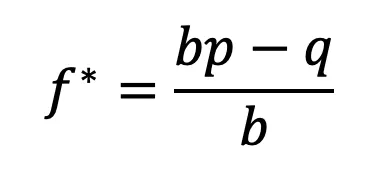
Where:
- f* = the fraction of your bankroll to allocate to a bet/investment (the Kelly exposure)
- p = the probability of winning
- q = the probability of losing (1 − p)
- b = the payout ratio (for example, in our Coin Flip game, you win $10 for every $10 bet, so b = 1)
Importantly, the formula identifies the position size that maximizes the rate of compounding over the long term, outperforming any other betting or allocation strategy when applied consistently. Can we apply this to our Coin Flip game? You bet!
Depending on how much data we collect, our observations can meaningfully influence our decisions:
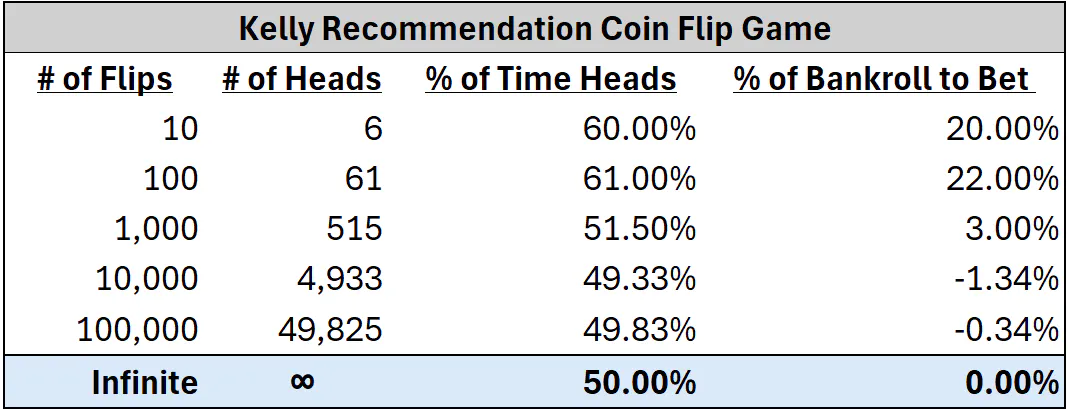
If we only look at the first ten flips and see Heads appear 60 percent of the time, the Kelly formula would tell us to bet 20 percent of our bankroll in a game that actually has no edge. As we observe more flips, the true probabilities converge toward 50/50, revealing that the game has zero expected advantage.
If we extend our simulation to 1,000 flips and observe Heads landing 51.5 percent of the time, we can plot consistent exposure bets (for example, 10% per flip) alongside the corresponding CAGRs over these 1,000 flips, assuming one flip per year. The results show that betting any meaningful percentage of capital leads to suboptimal outcomes, with the best possible result being break-even.
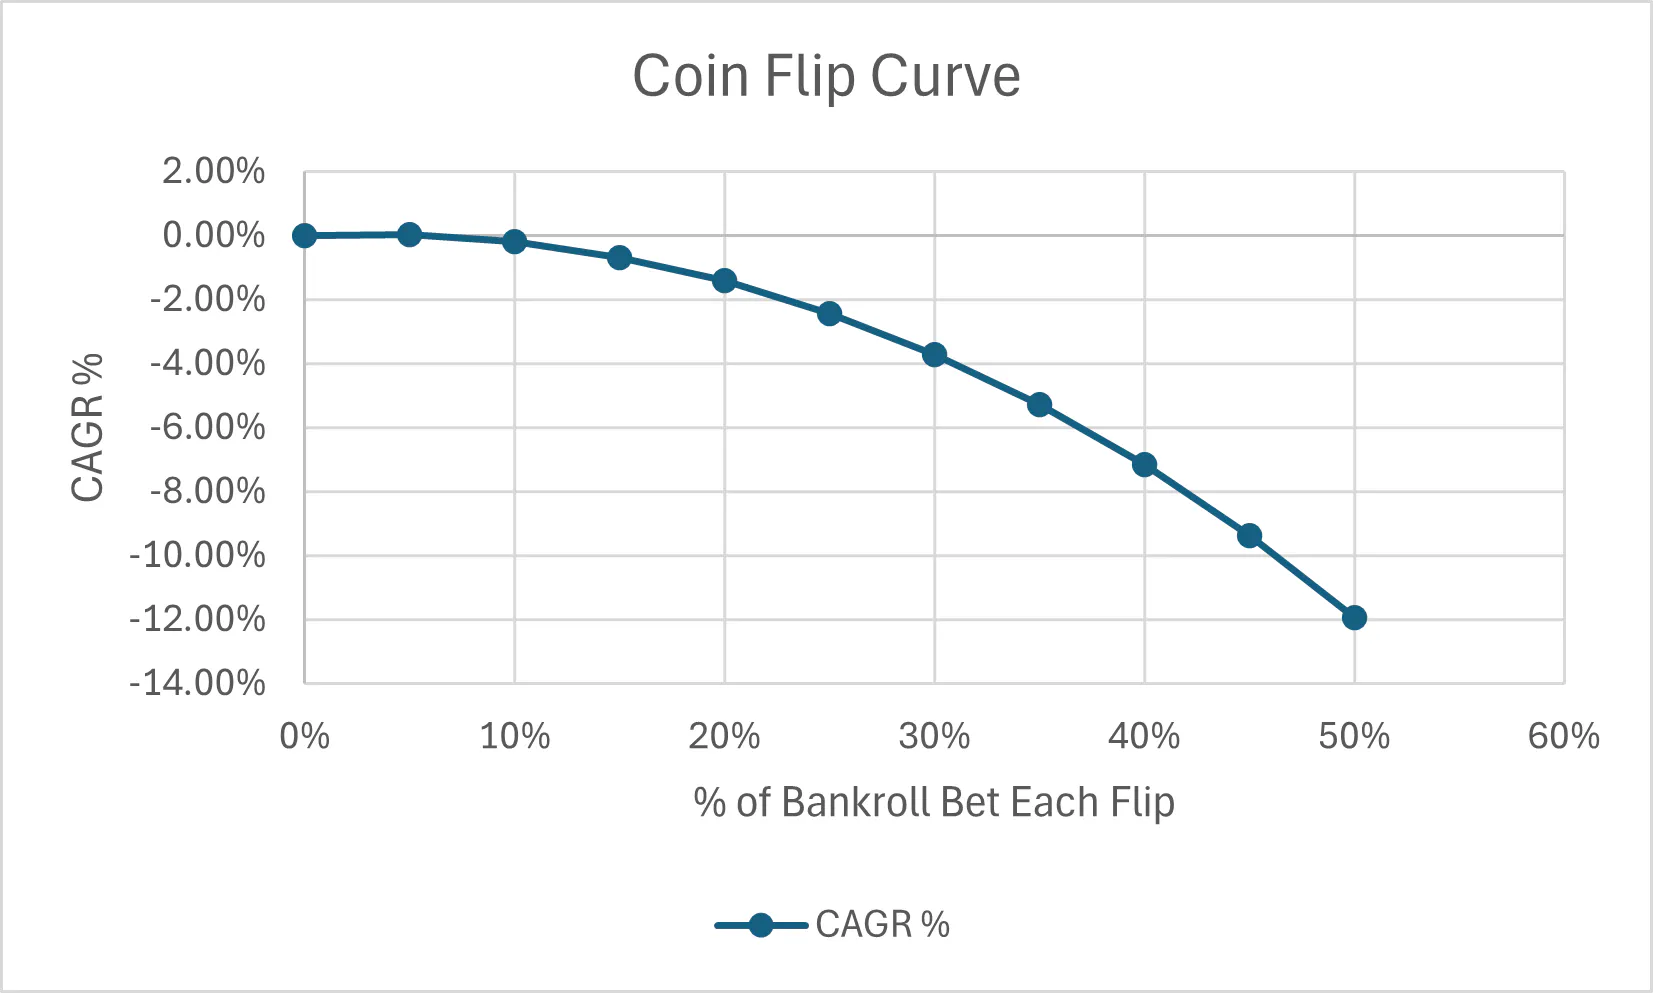
With no edge, it is not an interesting game to play, and the logical decision is to move on and find another table. Now imagine that just a few tables away, there is another coin-flip game with the following observed results:
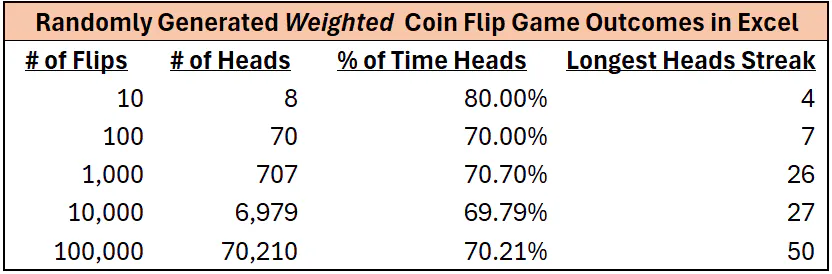
Suddenly, this is a very different proposition. This table looks far more interesting, with the coin landing on Heads about 70 percent of the time, a weighted coin. Given this information, what would Kelly suggest our bet size should be?
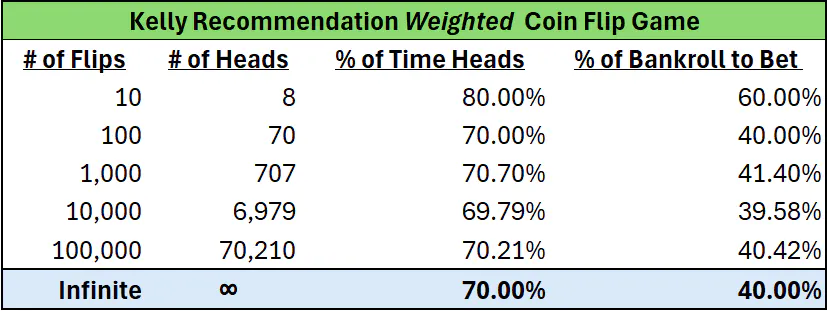
Kelly suggests we should bet 40 percent of our bankroll on Heads each flip, since the player now has a meaningful statistical edge. If we were to plot this game’s curve (which we refer to as its Kelly Curve), it would be clear that this is a game worth playing, and one we would want to play as often as possible!
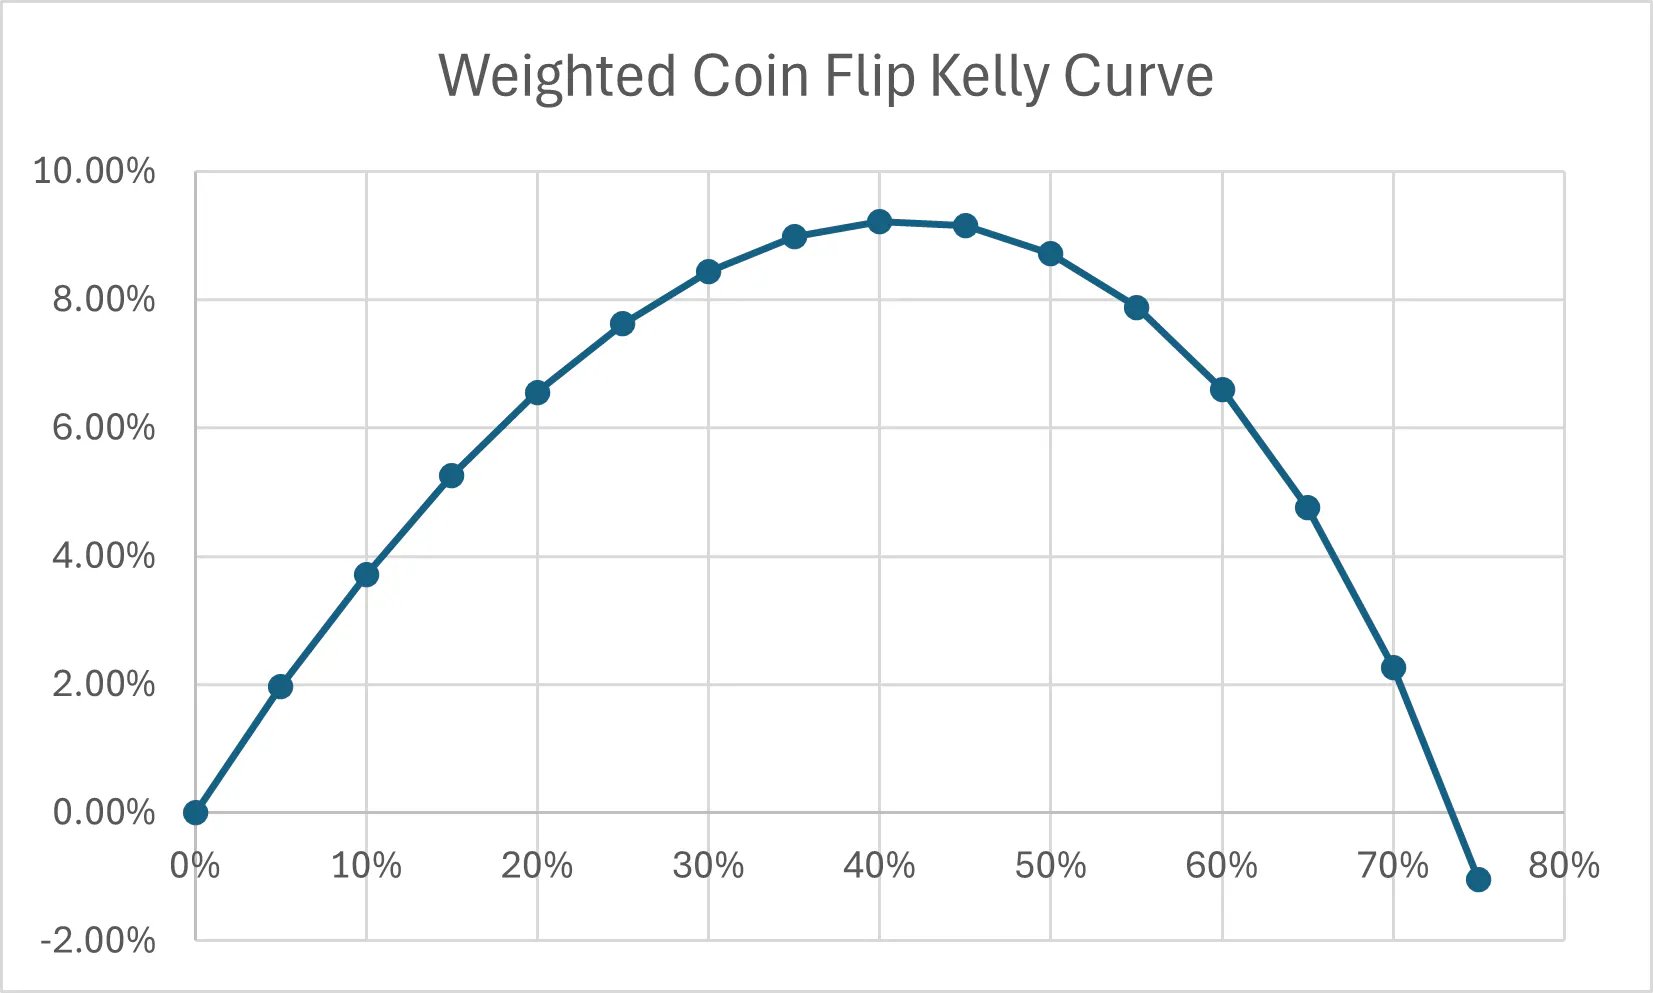
If the casino allowed us to play this game once per year, and we consistently bet 40 percent each time, our long-run compound annual growth rate (CAGR) would be about 8.6 percent. To put that in perspective, if we first sat down at this table on our 21st birthday with $100 and played once a year for 80 years, by our 101st birthday our bankroll would have grown to roughly $72,000 — a 722x increase on the original stake, not too shabby.
In fact, the game remains positive for us unless we meaningfully overbet Kelly. This occurs when we wager more than 70 percent of our bankroll per flip. Given the volatility of this game, and investing in general, overbetting can lead to what is known as gambler’s ruin. This is something we want to avoid at all costs, and there are several ways to mitigate this risk, which we plan to cover in future posts.
The key takeaway from this exercise is that some games are best avoided altogether, while others deserve our focus and commitment to play for the long term. In many ways, the same dynamic plays out in investing, where the “tables” we choose make all the difference.
From the casino to the markets
The good news is that we are in the largest casino in the world, with countless tables to explore. Some offer no or small, fleeting edges, while others present larger and more enduring ones. With a clearer understanding of how data science helps us identify which games are truly worth playing, we can focus on those with a lasting edge.
In future posts, we will explore how the public markets, perhaps the most fascinating game of all, can offer opportunities that endure for years and sometimes even decades. Check back for our next post as we keep our data science hats on and take this framework from the casino to Wall Street.
Enjoying this post?
Tell others about it.

Bancreek's Actively Managed ETFs
If you are interested in learning more about Bancreek Capital Advisors' actively managed ETFs click the link below
Learn MoreMore articles like this
Fetching Related Posts
There are no other articles tagged with Research
