
The hidden cost of a bumpy ride: what can we learn from turbulence?

Andrew Skatoff
Published
November 19th 2025
Andrew Skatoff
Published
November 19th 2025
In our last post, we talked about using data science, statistics, and tools like the Kelly Formula to evaluate whether a game in our theoretical casino is worth playing, and if so, how much to wager. Before we apply this framework to real-world markets, we will take a brief detour to discuss one of the most important concepts in investing: volatility.
A flight to Tahiti
Imagine you and a friend are about to take a vacation to the picturesque island of Tahiti. You both live in Seattle and happen to fly out at the same time, on the same type of aircraft, but on different airlines because, well, those loyalty programs are too tough to give up!
Now imagine this: your ten-hour journey over the Pacific Ocean is lined with five massive category-five hurricanes. Each storm takes about an hour to pass through, separated by stretches of perfectly clear sky. One airline chooses to fly straight through the storms to save on fuel. The other takes a longer, calmer path around them, cruising at a slightly higher speed and burning more fuel, but delivering a smoother, more typical ride.
Your airline prioritizes comfort and charts the path around the turbulence. You spend ten hours reading, daydreaming, and planning your beach days. Your friend’s airline barrels straight through the hurricanes. The flight is technically safe, but the passengers are gripping their armrests for hours on end.
Both flights arrive in Tahiti at the exact same time. You are relaxed and ready for paradise. Your friend looks like they just lived through an action movie. Neither aircraft was ever in danger, but one journey sure felt a lot worse.

The lesson
Why the flying analogy? Both passengers reached the same destination at the same time.
But one had a smooth ride. The other endured turbulence. The outcomes were identical, but the experiences were not. That’s volatility!
Volatility does not necessarily change where you end up, but it changes how the journey feels. Some investors can stomach sharp drawdowns, while others will panic and abandon ship, missing out on the eventual recovery. Just like pilots, investors must decide how much turbulence they are willing to endure to reach their destination.
Sometimes, volatility can also help us assess the quality of an asset or the repeatability of the journey we just took. If we flew the same airline and route 100 times (harkening back to our observation discussion from the casino) and it was consistently smooth, perhaps because the pilots prioritized customer experience, we would likely prefer that airline in the future and could reasonably expect similar results.
Conversely, if the other airline’s flights are consistently more turbulent flying the same routes, it might signal that the company prioritizes short-term profit over long-term customer experience. Beyond being a poor business model, this would likely be an airline you would want to avoid when planning your next vacation or business trip.
A tale of two assets
Well, what if we extended the concept of turbulence to investing? Imagine it is January 1, 2015, and you are grabbing lunch with another friend who also enjoys stock picking. They present you with an opportunity to invest in one of two different securities for the next decade. You each choose one of the assets and invest $1,000, finish your meal, and go on your way. Life gets busy, and you do not see your friend again for ten years. On January 1, 2025, you meet again to discuss how the two investments performed and are presented with the following table:

Everything looks the same as you scan across the columns until you reach the last one: annualized volatility. Annualized volatility is the standard deviation of periodic returns, scaled to a yearly basis. It helps measure how much an investment’s returns fluctuate over time. Returning to our airline example, we can think of annualized volatility as the turbulence rating for an investment. In this case, the two assets have very different ratings. Your friend then hands you a chart showing the two assets’ annual returns side by side.
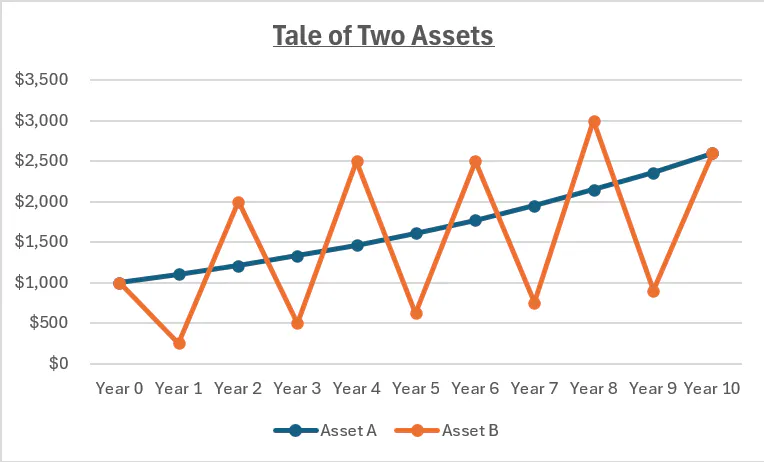
Outside of the rollercoaster ride experienced by the owner of Asset B compared to the steadier experience of Asset A, what can data tell us about these two assets that produced the same overall return but in such different ways? This is where volatility becomes more than just a measure of discomfort, it becomes a key variable in determining how efficiently we can compound capital.
Returning to the concept of the Kelly Formula, it can be a helpful tool for assessing the overall quality or attractiveness of a game, investment, or bet. There are a couple of important caveats when using the Kelly Formula that need to be highlighted:
- We are assuming these results will be repeatable and occur in the exact same order. Under that assumption, if we reinvest capital back into Asset A, we can expect to generate 10 percent each year going forward. Obviously, for a stock or any real-world equity, this type of stability is extremely unlikely, so this analysis is meant to exist in a vacuum.
- The time period we are assessing is long enough to give us a meaningful number of observations. Just like the coin flip game, where we needed more than a handful of flips to understand the true probabilities and outcomes, we want enough data points here to judge the behavior of the asset with some degree of confidence.
Ok, so with these caveats in mind, let's deploy Kelly. When we plot the Kelly curve for Asset A, it looks more like a ramp, steady, predictable, and always climbing upward.
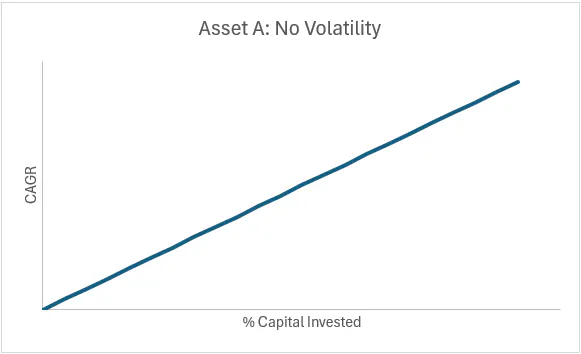
Since Asset A delivered identical returns each year and showed zero volatility, any level of exposure would have been safe from drawdowns. You could size the position as large as your capital or borrowing capacity allowed. If Asset A were a company, it would most likely be one with absolute pricing power, able to push through a 10 percent price increase every year on the same volume, or a 5 percent price increase combined with a steady 5 percent growth in volume. This would be one incredibly sticky business model, and certainly the type of company most investors would love to own!
When we generate the Kelly “curve” for Asset B, the story looks very different.
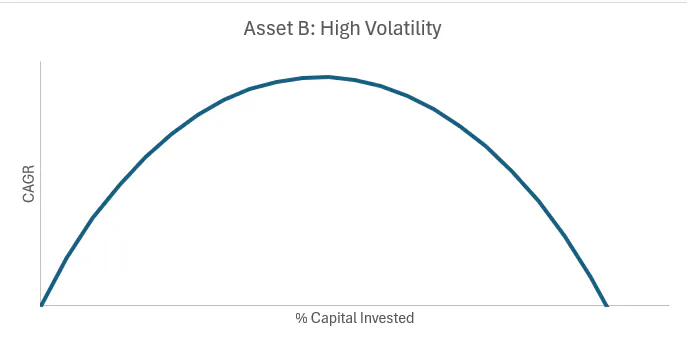
The chart now forms a rounded peak, showing that only a narrow range of investment sizes maximizes growth. Pushing past that point causes returns to decline and, beyond a certain level of exposure, the outcome eventually turns negative. This inverted parabola is a shape many assets and bets share with Asset B, although its height and width can vary significantly depending on the volatility of the return stream.
If Asset B were a company, it would most likely operate in a cyclical industry or a nascent one where competition is intense and barriers to entry are low. These conditions often lead to market and investor surprises. The shape serves as a reminder that as volatility in an asset or an event increases, understanding the risk profile becomes critical in two ways. First, it guides the appropriate sizing of the investment. Second, it sets expectations for what the journey may look like along the way.
Recognizing the cost of volatility before you invest
In our stock example, both investors started with a $1,000 position in each asset. Understanding the volatility of an asset class, an industry, or a business that grows revenue but does not yet generate free cash flow helps us better anticipate the possible paths an investment might take.
One of the biggest risks/costs associated with owning a volatile asset is the behavioral response it tends to create. Even an asset with strong long-term characteristics can become a poor investment if volatility triggers emotional decision-making. If a stock drops sharply in the first year after purchase, how likely is the investor to hold on rather than sell?
Decades of research have shown this behavioral pattern in action, comparing the returns earned by investors in mutual funds and ETFs to the funds’ own published returns. The gap is often wide. Many investors leave significant gains on the table by selling after poor performance and chasing what has recently done well, rather than staying the course.
Volatility exists on a wide spectrum. Rather than trying to avoid it, we aim to understand it. At Bancreek Capital Advisors, we look for companies with durable fundamentals and business models that can hold up across many economic conditions. These traits do not remove volatility, but they can help reduce unnecessary surprises and support a steadier experience over time. Guided by data and disciplined sizing, we focus on building portfolios that can navigate both calm periods and turbulence. We also recognize that every risky asset has its own version of an inverted parabola, where sizing beyond a certain point can work against long-term compounding. Being aware of this dynamic is one of the things that sets Bancreek apart, and it is why we devote so much time to making sure we are not "overbetting". When markets shift between rational and irrational, staying committed to process becomes the key to compounding.
From turbulence to opportunity
Volatility cannot be avoided, but it can be understood. And once we understand how it shapes our reactions and long-term results, we can invest with far more intention. This is the foundation of disciplined compounding.
In the next post, we return to the global casino. The equity tables await, and the choices become more complex. Which games are worth playing? How should we size our bets? The answers may surprise you.
Enjoying this post?
Tell others about it.

Bancreek's Actively Managed ETFs
If you are interested in learning more about Bancreek Capital Advisors' actively managed ETFs click the link below
Learn MoreMore articles like this
Fetching Related Posts
There are no other articles tagged with Research
