
Key takeaways from the January 2025 Consumer Price Index release

Eric Pachman
Published
February 12th 2025
Eric Pachman
Published
February 12th 2025
January 2025 year-over-year inflation (CPI) rises to 3.00%
This morning the Bureau of Labor Statistics released the January 2025 US Consumer Price Index (US CPI) for All Urban Consumers (CPI-U). Overall CPI-U was reported at 3.00% year-over-year (YoY) for January, up 11 basis points from 2.89% YoY last month.
As a reminder, Bancreek publishes two visualizations that can help you explore CPI-U in granular detail. Both of these visualizations have now been updated through January and are embedded below:
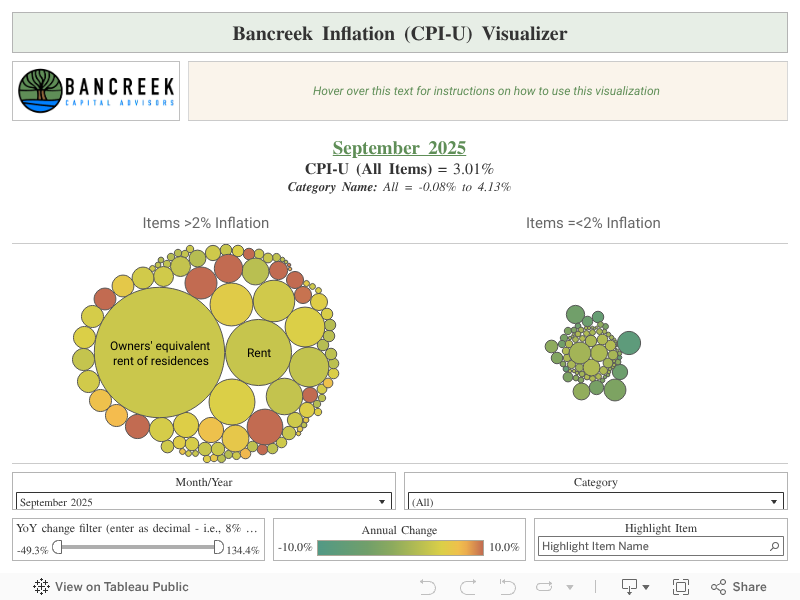
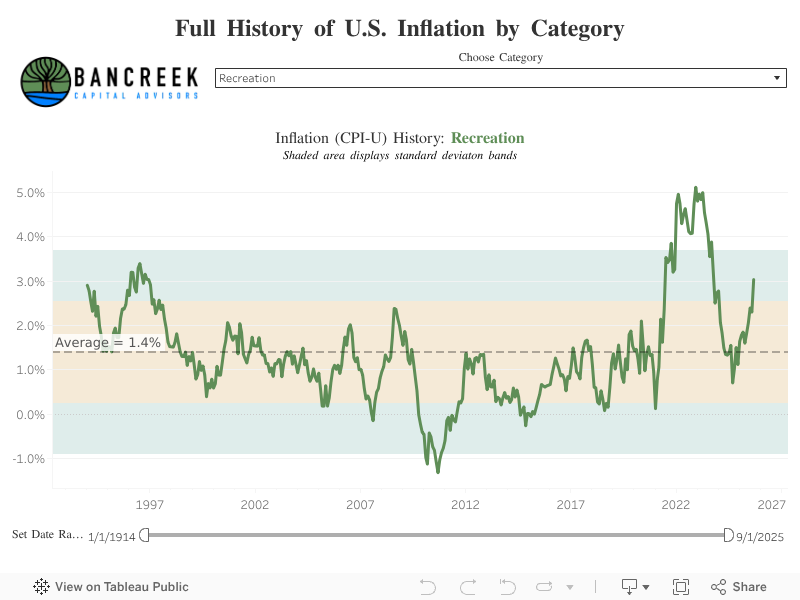
This post hopefully will further assist in your analysis of the moving parts underlying this month’s US Consumer Price Index (US CPI) report. Its goal is not to provide a comprehensive analysis of the nearly 180 items we track (that’s what the visualizations are for), but rather just to point to the most meaningful changes from one month to the next.
To perform this analysis, we track a measure we call “inflation impact,” which we calculate by multiplying each item’s YoY inflation by its weight in the prior year period. You can think of this as “weighted inflation” as opposed to the “unweighted inflation” that is more commonly reported by the media. Each month we take the weighted inflation of each item we track in CPI-U and then sum them up to overall CPI-U. Then we compare these weighted inflation numbers from one month to the next to see what drove the sequential increase or decrease. In this way, we can precisely identify the most significant drivers in the change in YoY CPI-U from one month to the next.
The items that changed the most in January
Our primary goal with our analysis each month is to explain the main drivers responsible for the change in CPI from the prior month to the current month. To that end, we have 11 basis points of additional YoY inflation in January when compared to December to explain. The following chart shows the items whose weighted inflation impact on US Consumer Price Index changed by +/-1 basis point. If you total all these items, you'll find that they added 16 bps to inflation, which means that the other 165+ items with a weighted inflation impact of less than +/-1 basis point had a modest disinflationary impact in January (-5 basis points).

US Consumer Price Index fluctuations
Key shelter items continue their run of modest month-over-month inflation
This month we've decided to start with the good news - inflation on key shelter items (namely, OER and Rent) remain at relatively subdued levels. As shown below, Owners equivalent rent of residences ("OER") and Rental of primary residences ("Rent") moved up by 34 basis points and 32 basis points, respectively. This marks the third consecutive month that these two items (which as a reminder, together comprise over 34% of the CPI-U index) both remained below 40 basis points of month-over-month inflation.

Source: Bancreek Capital Advisors, LLC
As we have written ad nauseum, due to US CPI's heavy concentration in these two shelter items, it is critical that they remain around 30 basis point MoM inflation (or hopefully lower) for CPI to drift towards the Fed's long-term objective. This view is simply based on annualizing different month-over-month inflation rates. Annualized inflation at month-over-month inflation levels of 40, 35, and 30 basis points are 4.9%, 4.3%, and 3.7%.
Note that all three of these numbers are well above the Fed's target, but the 30 bps inflation level provides at least some hope of getting there, whereas the 40 bps level erases much of this hope. When we run the math, we get that if these two items settle at 30 bps of MoM inflation, all other items need to put up a weighted average inflation of 1.9% to get headline CPI to be 2.5%. Meanwhile, if they settle at 40 bps of MoM inflation, all other items have to drop to 1.3% weighted average inflation to print the same 2.5% headline CPI. That's a big difference, which is why its comforting to see these two items stabilizing in today's numbers.
Motor vehicle insurance back to its bad habits
Sadly, the stability in OER and Rent is all the good news we have to report. So, onto the bad news, starting with a very unfortunate development in Motor vehicle insurance. As shown below, this item had been one of the biggest problems for CPI over the past few years. In fact, between January 2022 and April 2024, Motor vehicle insurance inflated at an average of 141 basis points per month. We won't annualize this for you, as we just went through that exercise in the last section for monthly inflation rates for shelter items that paled in comparison to Motor vehicle insurance. Thankfully, we got some reprieve from May to December 2024, with MoM inflation on this item dropping to 43 basis points. And then we got today's number, which was back up to a vomit-inducing 221 basis points. This was such a large MoM number that it completely stalled the path of YoY disinflation that was forming in the past few months - YoY inflation actually rose to 11.8% in January from 11.3% last month on this item. This is really unfortunate, as going into this month, we had this one item pegged as the biggest single source of disinflation moving forward. That hope just went out the window with today's data.

Bancreek Capital Advisors, LLC
More bad news for auto inflation: Used car prices on the rise
Let's take a quick trip back in time to July 2024 using our US CPI data visualizer. As shown below, over on the right side of the chart is a large green bubble labeled Used cars and trucks. Hover over this bubble and you will see that this single item had an inflation impact of -30 basis points - by far and away the single largest favorable item in CPI at the time.

Source: Bancreek Capital Advisors, LLC
How times have changed... Just six months later what was a 30 basis point favorable impact to CPI has flipped to a 2 basis point unfavorable impact to CPI.

Source: Bancreek Capital Advisors, LLC
While July's magnitude of deflation wasn't sustainable (the item was cycling very high comparisons back then) we still had hope that sequential inflation would remain close to zero going forward, smoothing the inflationary impact out. This wasn't in the cards in January, with Used cars and trucks rising 53 basis points month-over-month, just over four times its historical average.
Prescription drug inflation takes off in January
Probably the biggest surprise of the month was Prescription drugs, which rose by a record (for this item) 2.49% MoM in January.

US Consumer Price Index
This monthly inflation print was so extreme that it lifted this item's year-over-year inflation from 1.1% last month to 4.5% this month.

Source: Bancreek Capital Advisors, LLC
Now, we happen to know a thing to two about U.S. drug pricing, dating back to our Chief Analytics Officer's work with 46brooklyn. And from that knowledge and experience, all we can say with confidence is we have no faith in the meaningfulness of this measure. When analyzing drug prices, mix is the single biggest factor, which is nearly impossible to fully control for in these types of analyses. Moreover, given that this is supposed to be the consumer's perspective, you also have to throw in changes in insurance coverage to accurately split out the cost share. This is an impossible task to do on a small scale, let alone for the entire country (we don't envy the BLS). What is true is that drug prices are in the eye of the beholder. The BLS happens to be one (arguably, quite important) "beholder," whose opinion is that prices just rose more in January 2025 MoM than they have, well, in the recorded history of the data (back to 2005). We'll leave the debate on how "true" this is to others... the number is what it is, and provided a very unpleasant shock to core CPI this month.
Egg prices continue to soar
The last item we will highlight needs no introduction, especially if you have recently gone grocery shopping and been subjected to restrictions on the number of egg cartons you're able to purchase. According to the BLS, egg prices were up 13.80% MoM! You read that right - egg prices were nearly 14% higher in January than they were in December (if you could find them at all). That brought YoY Egg inflation to 53.0%, which translates to an inflation impact of 6 basis points - a meaningful inflation impact for an item with such a miniscule weight. Eggs carry a 0.12% weight of the CPI index. For comparison OER's weight is 26.8%, making it 223 times larger than Eggs in the eyes of the US Consumer Price Index (US CPI) gods.

Source: Bancreek Capital Advisors, LLC
Tariff risks makes forecasting inflation a useless exercise
The past few months we have published some scenarios to help you think about the range of outcomes for CPI over the coming months. We felt confident offering this "forecast" because most CPI items had stabilized over the course of 2024, allowing us to roll forward such stability (flexing some of the key items up and down a bit) to see what impact they would have on year-over-year inflation. It's now clear that we can no longer count on stability to persist. The on-again, off-again threat of tariffs makes it impossible to stand behind any forecast, in our view. Just last week on socials we lamented that Canadian / Mexican tariffs could add up to 40 basis points to headline inflation alone. And that's just based on the direct impact on two items, rather than an exhaustive analysis of the dozens of items that tariffs would undoubtedly touch either directly or indirectly.
Now we have more uncertainty to add to the mix with the gut punch we got from Motor vehicle insurance and Prescription drug prices this month. It's too early to tell if these are errant data points, or the start of renewed inflation for these sizable items.
Upsetting data is better than no data at all
Unfortunately we can't conjure up an optimistic ending to this post. The data and confusing narrative just doesn't support it. But we will offer our (admittedly biased) perspective that given all the uncertainty it's now more important than ever to have accurate, data-driven, and timely analysis of public datasets. Bancreek Capital Advisors is proud to have offered exactly this to you for a year now, and hope we have the chance to continue to offer this public service as we move forward into a more uncertain environment. We will continue to publish our research and data visualizations so long that critical public databases are maintained by the BLS and BEA. This sadly is not guaranteed anymore though. Here's to hoping public data remains available for all of us to analyze, even if the data isn't what people want it to be. Because the only thing worse than analyzing upsetting data is not being able to analyze data at all.
Enjoying this post?
Tell others about it.

Bancreek's Actively Managed ETFs
If you are interested in learning more about Bancreek Capital Advisors' actively managed ETFs click the link below
Learn MoreMore articles like this
Fetching Related Posts
There are no other articles tagged with Research
