
Key Takeaways from the February 2025 Nonfarm Payrolls Report

Eric Pachman
Published
March 11th 2025
Eric Pachman
Published
March 11th 2025
Nonfarm payrolls increase by 151k in February. Private payrolls up 140k.
Last Friday the Bureau of Labor Statistics (BLS) released February 2025 Nonfarm payroll data. Total nonfarm payrolls rose by 151k, inclusive of a 140k increase in Total private jobs. Today's release also included a two-month payroll net downward revision of -2k jobs. This downward revision lowered January 2025's month-over-month job additions to 125k jobs, 81k of which were private jobs.
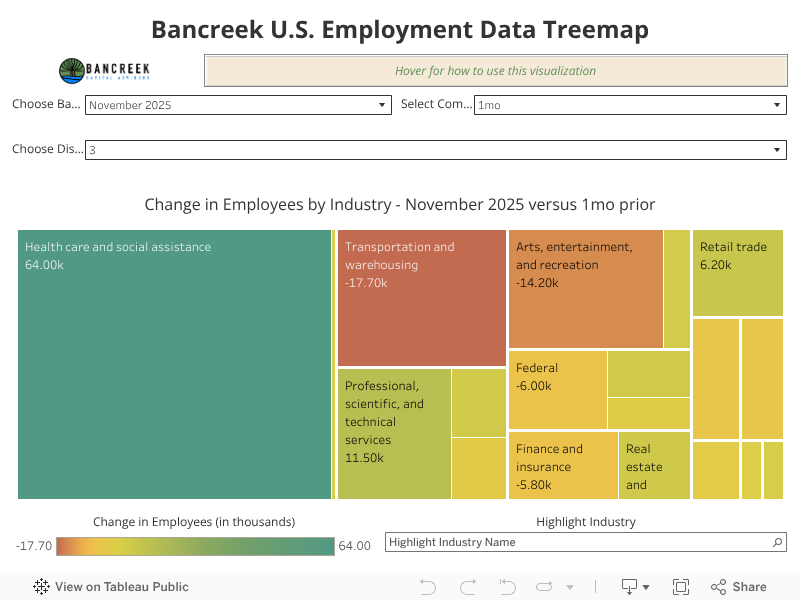
Before we dive into our take on all the moving parts in today's Nonfarm payroll data release, we'll first share that we've updated the Bancreek U.S. Employment Data Treemap with today's data (embedded below). So, if you are the type that just wants the visualization and less words, here you go. Also, as a heads up, it usually only takes us 10-15 minutes to update and repost this visualization on bancreek.com, versus a lot longer to gather, write, and publish our thoughts. So, if you want to play with this viz as soon as its ready on Nonfarm payroll data release day, make sure to bookmark this page.
U.S. health care is just built different
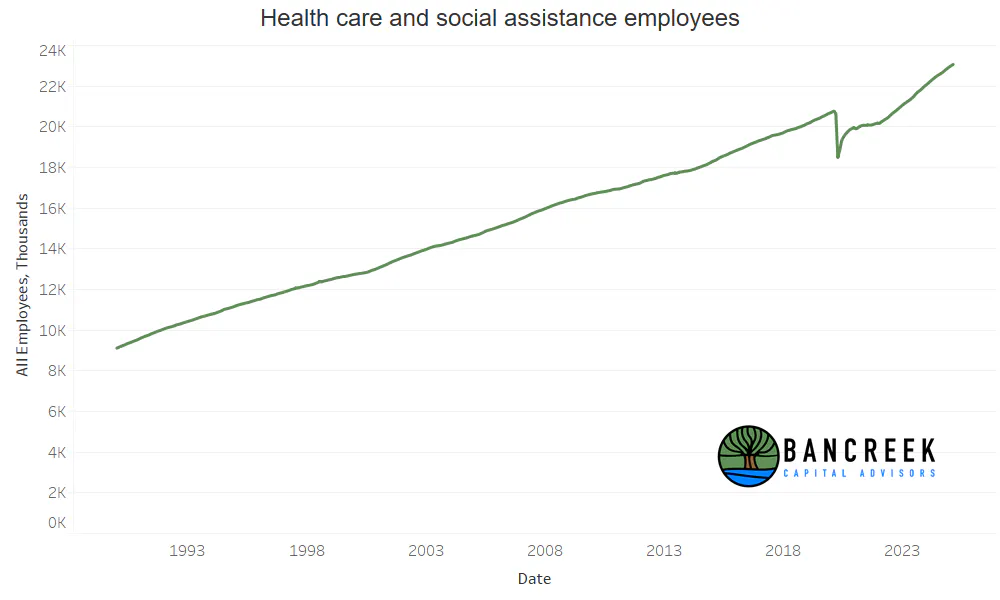
Can we take a moment to just marvel at the following chart:
Source: Bancreek Capital Advisors, LLC
Say what you will about the U.S. health care system. Everyone seems to believe it's broken and in need of fixing, but no one quite knows how to put the toothpaste back in the tube. But what this chart suggests is that maybe the goal of the U.S. health care system is not to provide health care. Maybe it's to create jobs. For argument sake, if job creation were the goal, our health care system is designed to perfection, as outside a brief COVID blip, it has created jobs at a torrid pace no matter the macroeconomic climate.
We'll leave the judgement of what the health care system should be doing to others... all we'll say is that the way its designed today, health care is a job creation machine. That doesn't mean we shouldn't work to improve access and cost. It's more of a reminder that there are tradeoffs when making any major changes to systems as interconnected and complex as U.S. health care. If we are able to somehow manifest a highly efficient, transparent cost, equitable access health care system without stalling innovation, well, this unicorn of a system shouldn't require as many jobs, right? So, while this would be a good thing for U.S. citizens, it would almost certainly hamper the single largest engine of U.S. job growth.
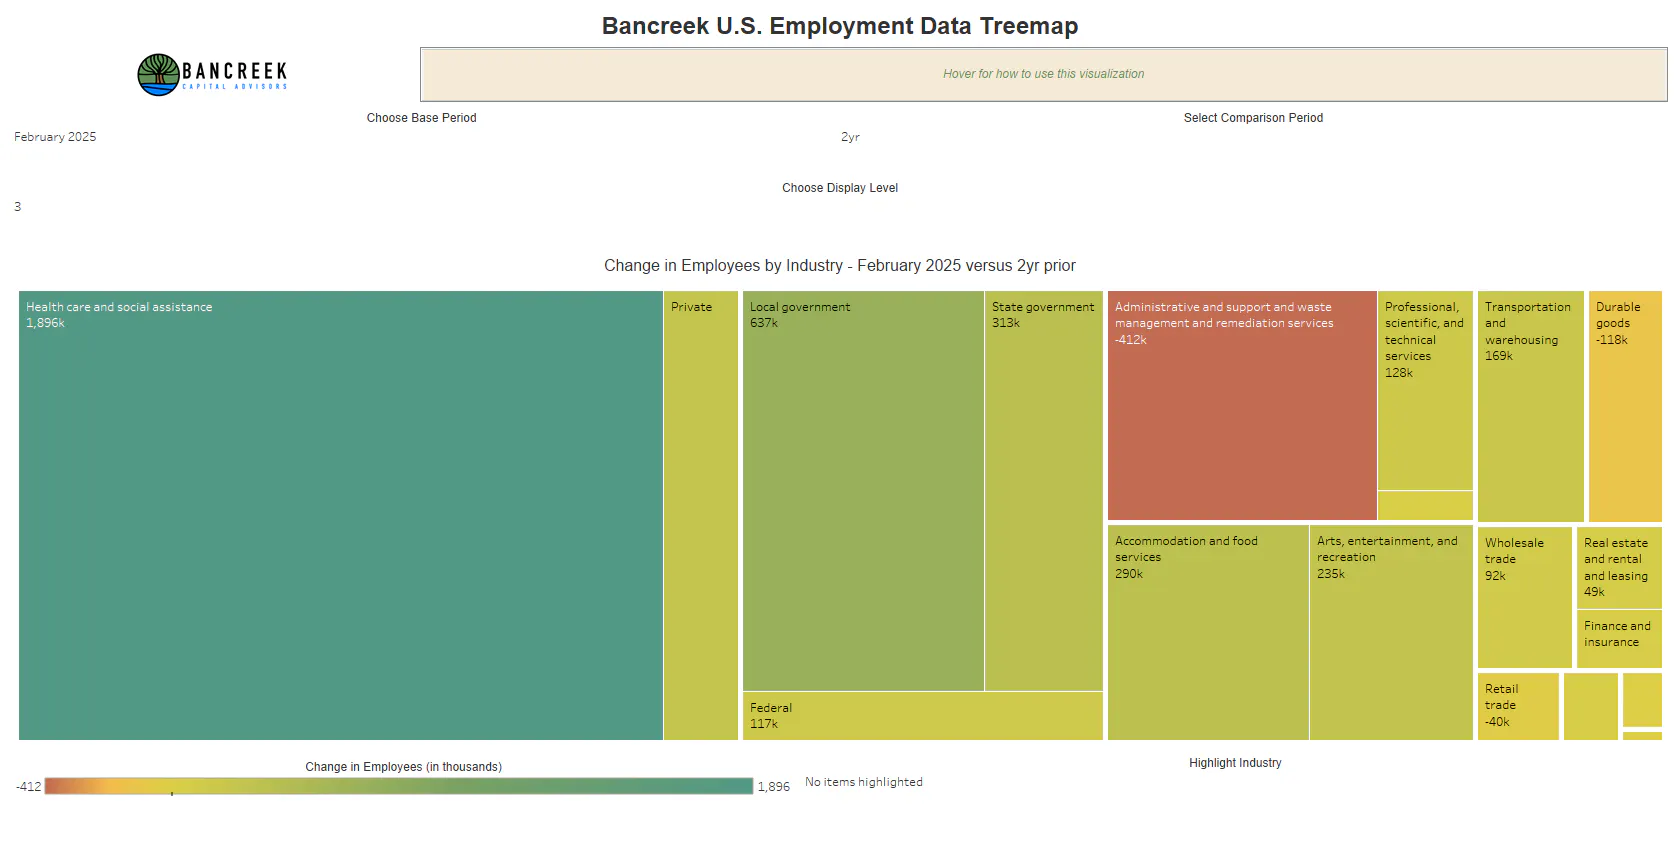
This becomes quite concerning as you spend more time poking around in our data visualization. Consider this... Over the past two years, the U.S. has added 3.065 million new jobs. That works out to be 128k per month, which isn't too shabby. If we drew conclusions from this number directly, maybe we would characterize the job market as strong over the past two years. But then what if we told you that over the same period the U.S. added 1.896 million new Health care and social assistance jobs (shown below).
Source: Bancreek Capital Advisors, LLC
This works out to be 62% of the total new private jobs created over the past two years. If we removed these healthcare jobs from the mix, the U.S. has only added, on average, 49k non-healthcare private jobs per month over the past two years - a pretty anemic rate. Tej Parikh from the Financial Times summed this up perfectly in the title of his labor market analysis last year, "America: a healthy or healthcare economy?" The more time has passed, the more it's looking like it could be the latter.
Federal government jobs down, but more than offset by increase in Local government jobs
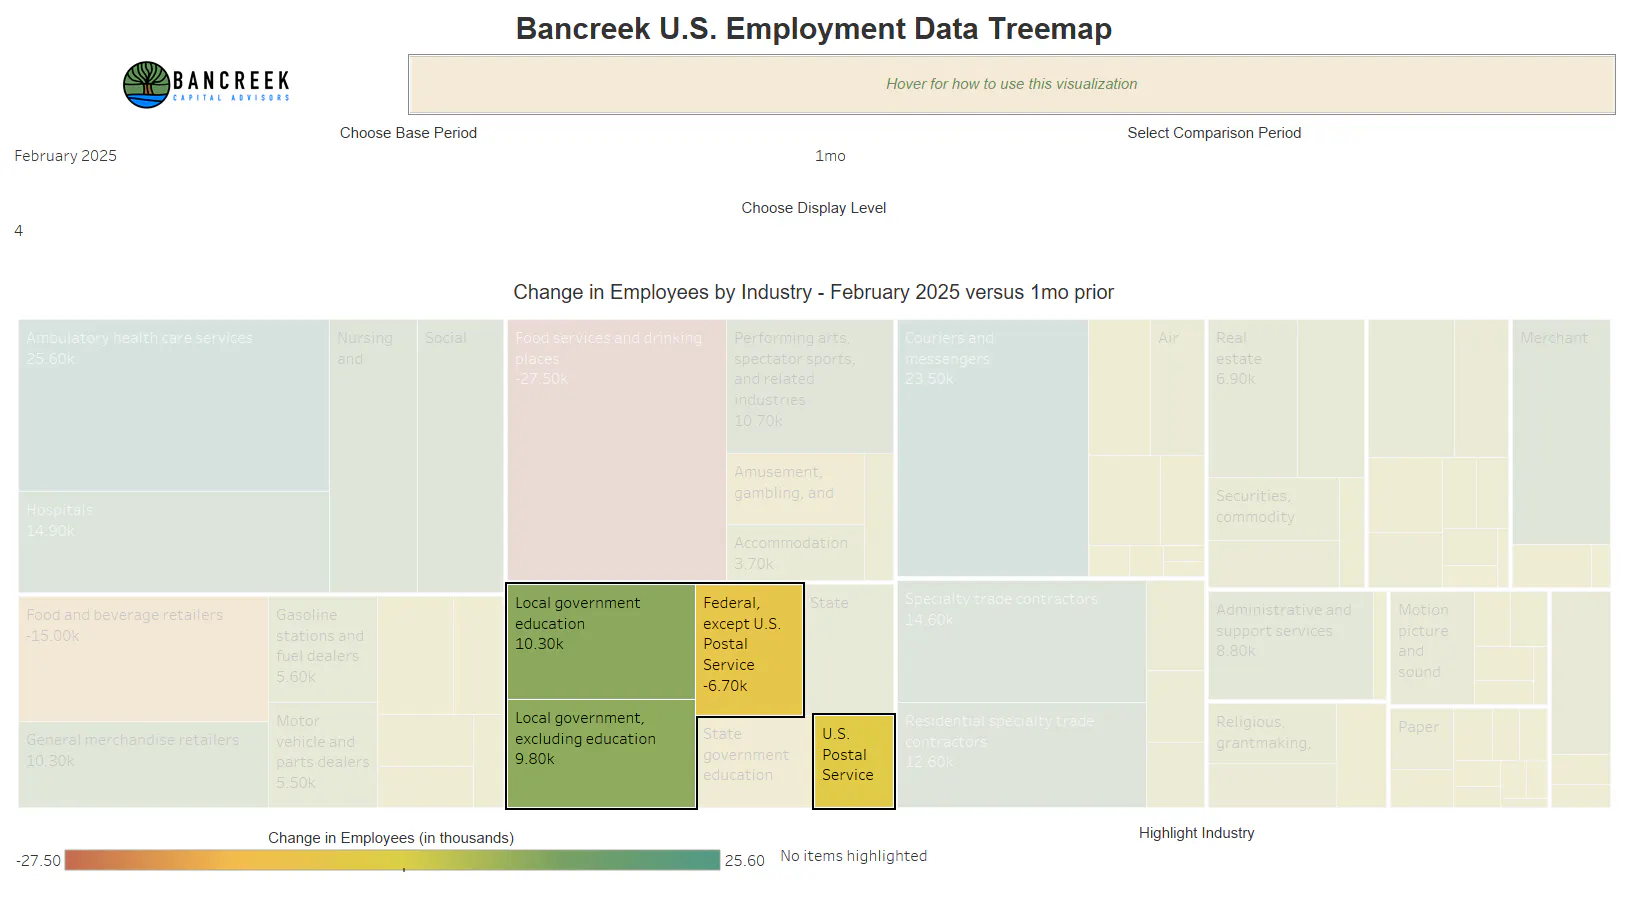
Arguably one of the most anticipated components of last week's nonfarm payroll data release (thanks to DOGE) was the change in Federal government jobs. As shown in our data visualization, Federal government jobs were down -10k (hint: change the Display level to "3" to see this). We can further break this down to a -3.5k decline in Postal Service jobs and a -6.7k decline in "Federal, except U.S. Postal Service" jobs (hint: change the Display level to "4" to see this).
But as shown below (or in the data viz if you are poking around it while reading this), these Federal job losses were way more than offset by increases in Local government jobs, which increased by 20k month-over-month.
Source: Bancreek Capital Advisors, LLC
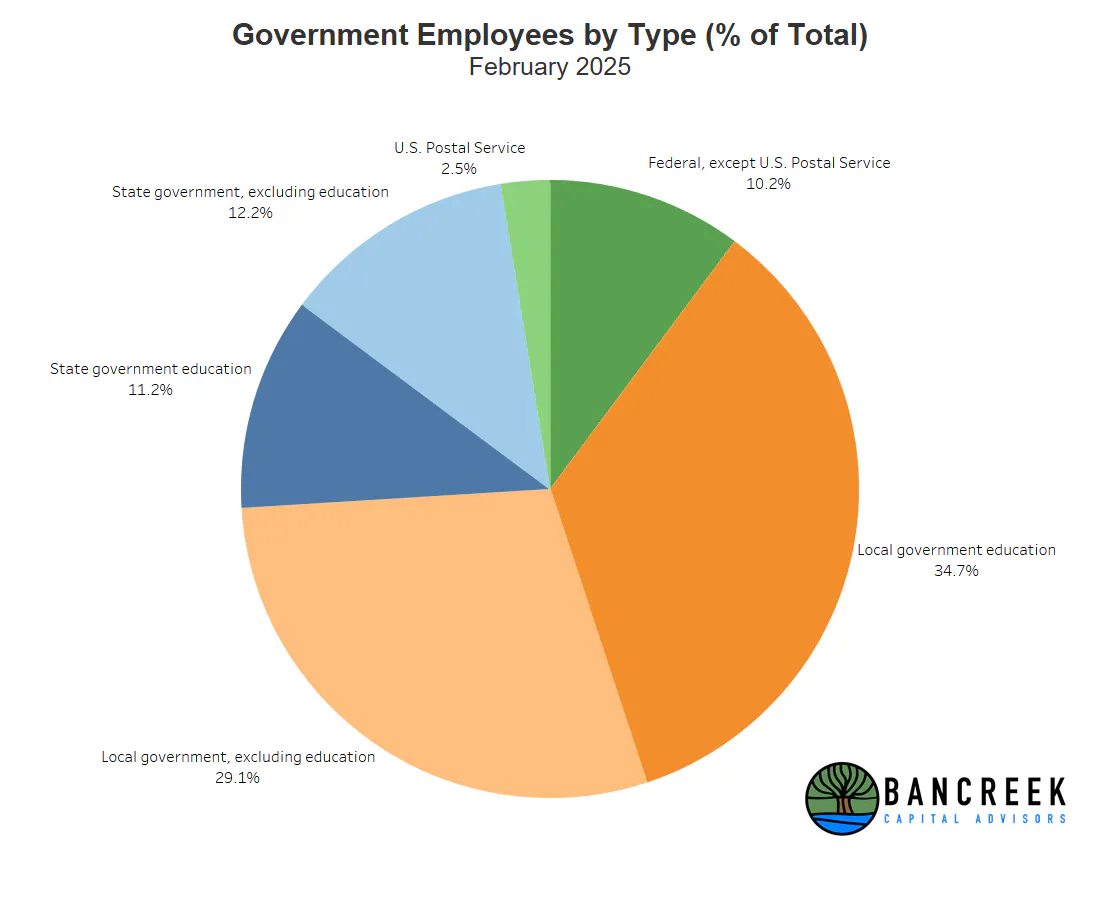
It's tempting to try to read into this month's data as the start of some logical shift of government jobs from Federal to Local (and or State). But, in our view, it's premature to conclude that this is happening from the data. Rather the only conclusion that we are comfortable making right now is that there are far less Federal government jobs than there are State and Local government jobs. Moreover, a large percentage of State and Local government jobs are in education, which at least at this stage, seems to be outside the reach of DOGE (although cutting NIH funding theoretically could put State education jobs at risk). In short, as far as the overall government labor force goes, all DOGE can directly attack is the two smallest slices of the pie (the green ones in the chart below).
Source: Bancreek Capital Advisors, LLC
Restaurant hiring takes a breather, while couriers and messenger hiring spikes
If you have spent any time navigating around in our data visualization you'll note that there are dozens of interesting data points to call out. We'll choose two more to highlight as both really caught our eye this month.
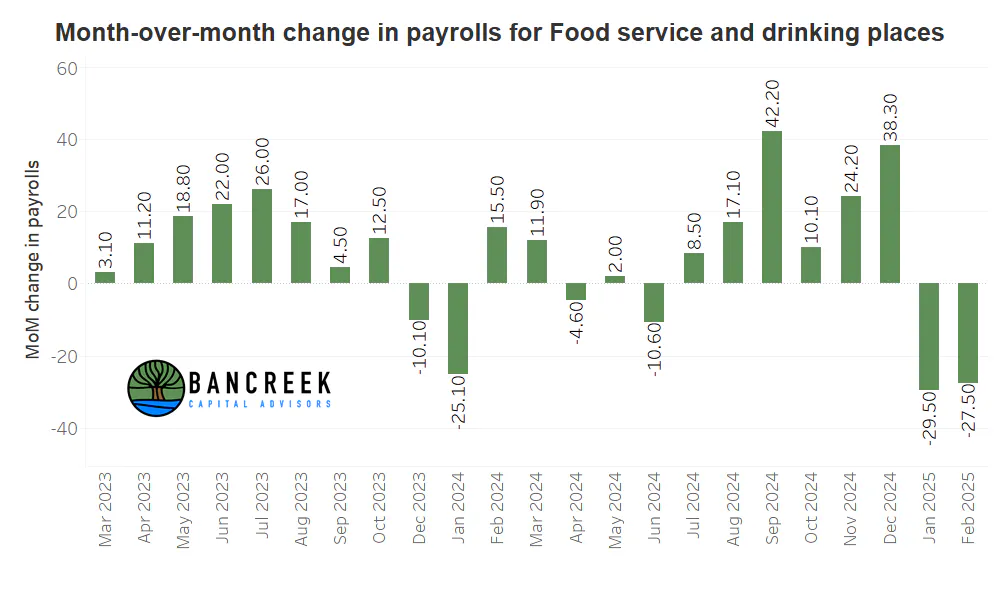
First, after reaching an all time at the end of 2024, Food services and drinking places payrolls have now declined pretty meaningfully two months in a row (down -29.5k in January 2025, down -27.5k in February 2025). This is notable, as this industry was one of the big drivers of employment growth in 2024, adding 129.5k jobs last year. In fact, job growth in 2024 really could be summed up as being driven by health care, government, and leisure and hospitality. These were the three legs of the job growth "stool" in 2024. Fast forward to 2025 and at least two of these legs are now at risk. We are feverishly trying to saw off one leg (government jobs) while another leg (leisure and hospitality) is looking like it may need to be replaced.
Source: Bancreek Capital Advisors, LLC
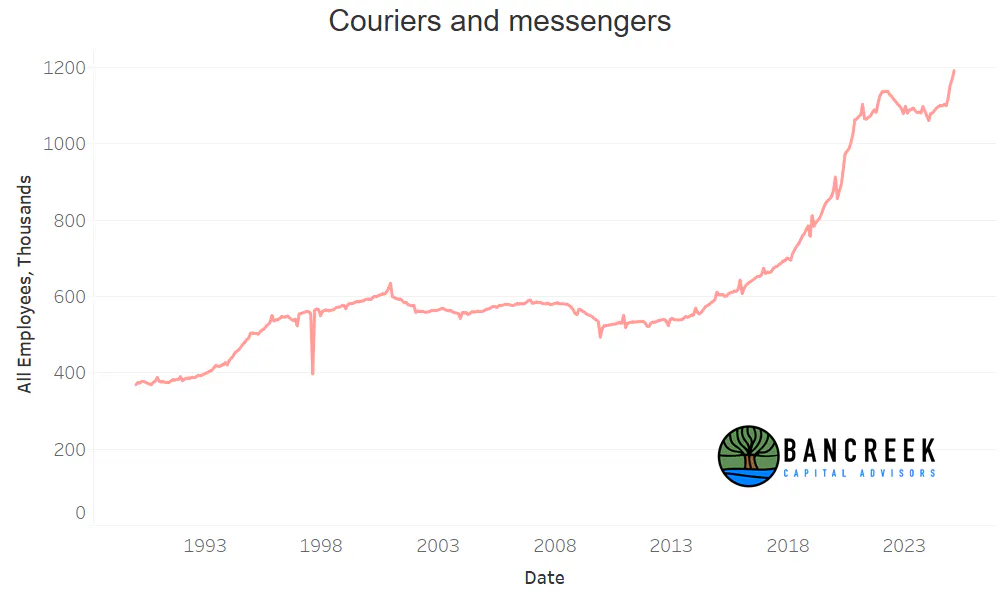
But let's not end this post on such a downer. Rather we'll end this post by highlighting the long-term trend chart for Couriers and messengers, which has shot straight up since October 2024. We have no theories or conjectures to explain what is going on with this industry over the past few months. However, it is a good reminder that as bleak as things may look, there always seem to be pockets of labor market strength emanating from some of the most random places.
Source: Bancreek Capital Advisors, LLC
Enjoying this post?
Tell others about it.

Bancreek's Actively Managed ETFs
If you are interested in learning more about Bancreek Capital Advisors' actively managed ETFs click the link below
Learn MoreMore articles like this
Fetching Related Posts
There are no other articles tagged with Research
