
Is May 2025 PCE showing early signs of tariff-driven inflation?

Eric Pachman
Published
June 27th 2025
Eric Pachman
Published
June 27th 2025
May 2025 year-over-year core and headline PCE both on the rise
This morning, the Bureau of Economic Analysis released the May 2025 PCE inflation report. Overall PCE was reported at 2.34% year-over-year (YoY) for February, up 14 basis points from 2.20% (revised) year-over-year last month. Meanwhile, core PCE increased to 2.68% in May 2025 from 2.58% (revised) in April 2025.
As a reminder, Bancreek publishes two visualizations that can help you explore PCE in granular detail. Both of these visualizations have now been updated through May 2025 and are embedded below:


This post hopefully will further assist in your analysis of the moving parts underlying this month’s PCE report. Its goal is not to provide a comprehensive analysis of the ~180 items we track (that’s what the visualizations are for), but rather just to point to the most meaningful changes from one month to the next.
To perform this analysis, we track a measure we call “inflation impact,” which we calculate by multiplying each item’s YoY inflation by its weight in the prior year period. You can think of this as “weighted inflation” as opposed to the “unweighted inflation” that is more commonly reported by the media. Each month we take the weighted inflation of each item we track in PCE and then sum them up to overall PCE. Then we compare these weighted inflation numbers from one month to the next to see what drove the sequential increase or decrease. In this way, we can precisely identify the most significant drivers in the change in YoY PCE from one month to the next.
Exploring the major drivers of incremental inflation
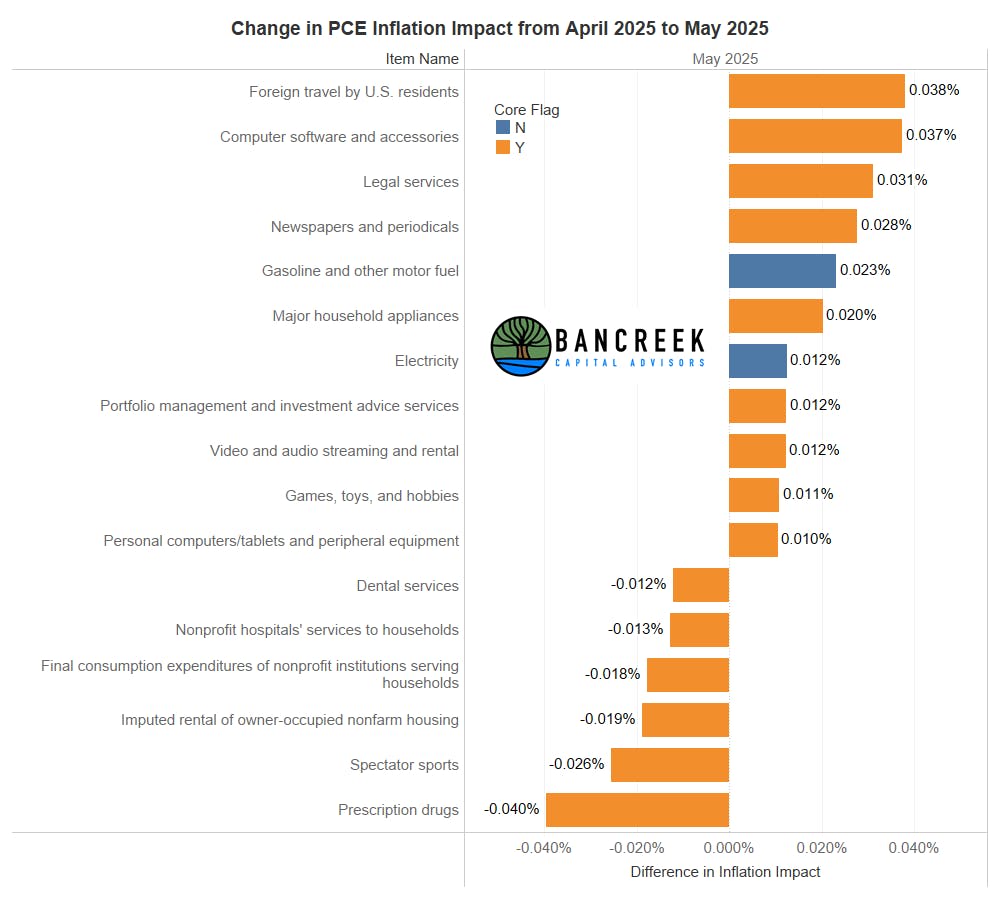
One of our favorite charts to lead these inflation posts with is our "Change in inflation impact" chart, which is shown below. In short, this chart breaks down the biggest drivers (both favorable and unfavorable) of the change in YoY PCE from last month (2.20%) to this month (2.34%).
Source: Bancreek Capital Advisors analysis of data from bea.gov
No matter how you cut the data this month, it's clear that PCE advanced compared to last month's much lower print. The headline data tells us this, while core data tells the same story. The number of items we track that inflated more than 10% also tells the same story, doubling from three last month to six in May. The above chart drills deeper into the items driving this month's inflationary pressure, showing us that there were many more unfavorable items putting upward pressure on inflation than there were favorable disinflationary items.
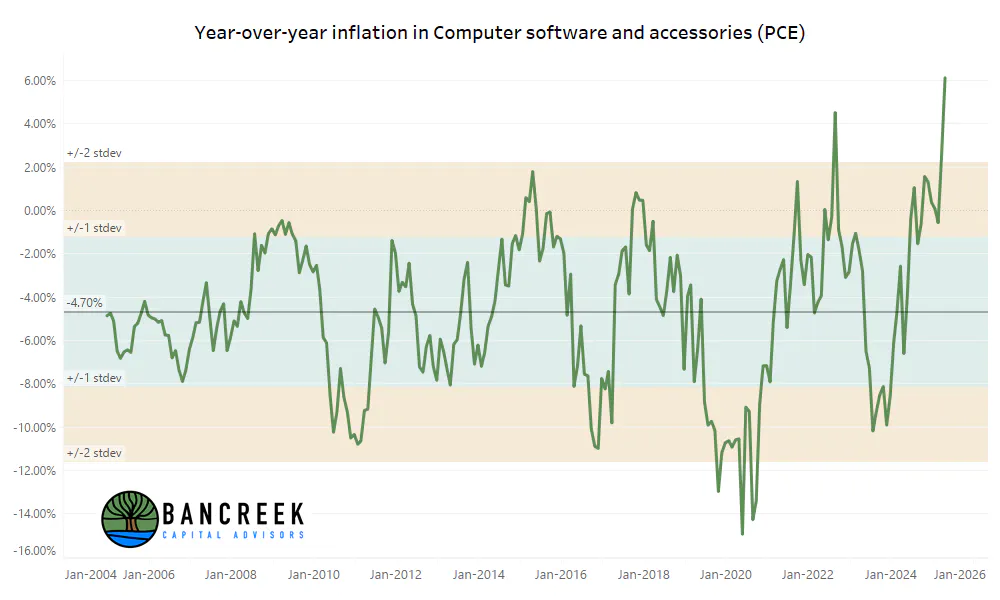
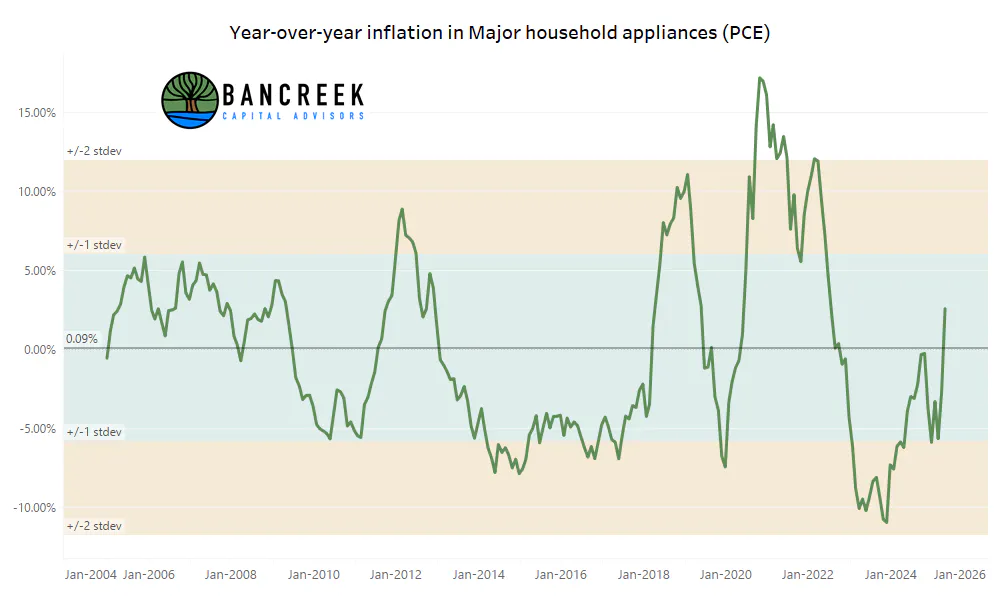
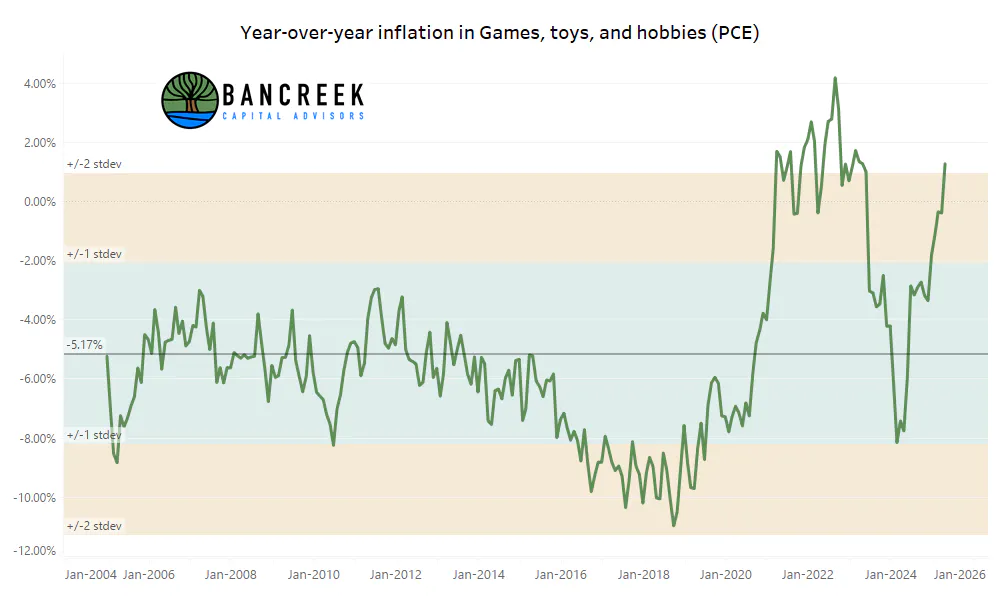
What's interesting to us is that there are some new items on this list, which seem like items that could be facing tariff pressure. Of course, there is no way for us to know this for sure from the data, but after seeing not much movement at all in such items, some sharp upward spikes in these data (see below) caught our attention this month.
Source: Bancreek Capital Advisors analysis of data from bea.gov
Source: Bancreek Capital Advisors analysis of data from bea.gov
Source: Bancreek Capital Advisors analysis of data from bea.gov
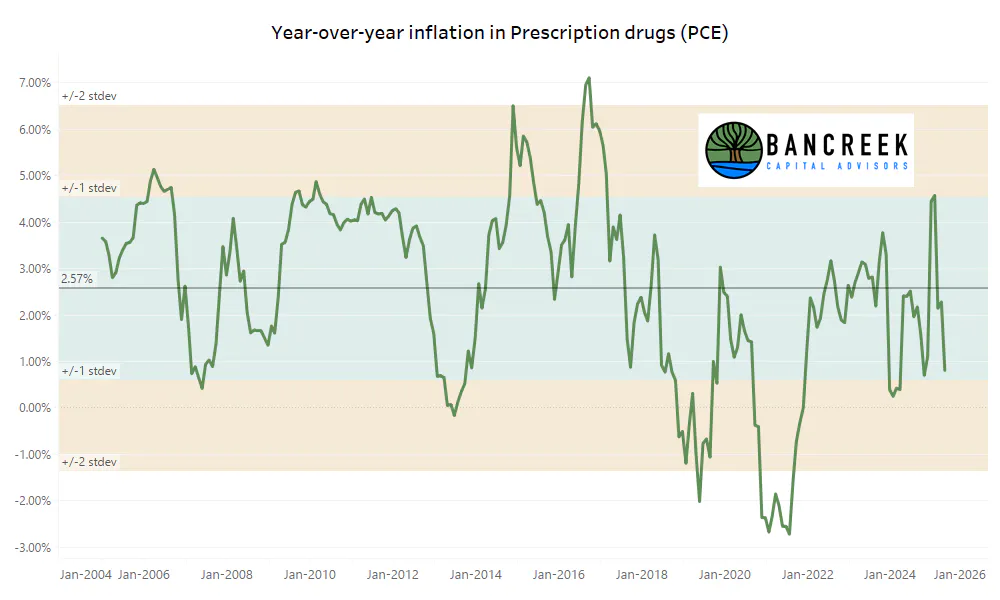
Meanwhile, the largest disinflationary force this month was Prescription drugs, which shaved four basis points off headline inflation (note, headline PCE would have rounded to 2.4% if we exclude this one item's impact). Of all the items, Prescription drugs is the one for which we have the strongest opinion on its quality. In short, thanks to years of studying prescription drug pricing we're quite comfortable with our opinion that this item is it's a very poor indicator of what it is attempting to measure. It's not the BEA's fault. Rather, blame it on the needless complexity of the drug supply chain, which feasts on hidden prices and rebates. Further complicating matters is that any measurement of drug price inflation is heavily influenced by the drug mix, which varies considerably from one payer to the next. Long story short, we largely consider the Prescription drug item within PCE to be a random number, rather than representative of any real inflation or deflation in prescription drugs. More importantly for this discussion, we see the deflationary impact of this item as very low quality, rather than the start of some trend that should aid PCE going forward.
Source: Bancreek Capital Advisors analysis of data from bea.gov
Will a whiff of tariff inflation keep the Fed on hold?
To be fair, if we had to zoom out and summarize this month's PCE report, it would be largely as expected. While core PCE came in hot versus consensus, the items that drove it carry relatively small weights. As such, you could argue if these items really spiral out of control, there is only so much damage they can do to PCE. But, let's be honest. The market feels like it is not pricing in much (if any) risk that inflation starts accelerating at the moment. As such, we found it a touch unsettling to see a even a few items that appear to be breaking out from their recent trend lines. Will this whiff of tariff risk be enough to keep the Fed on hold longer than the market expects? Probably not... especially with mounting risks to the job market which we have been exploring in depth lately. But it's something to keep an eye on. And we'll do exactly that for you going forward.
Enjoying this post?
Tell others about it.

Bancreek's Actively Managed ETFs
If you are interested in learning more about Bancreek Capital Advisors' actively managed ETFs click the link below
Learn MoreMore articles like this
Fetching Related Posts
There are no other articles tagged with Research
