
The path of U.S. inflation hinges on the showdown between homes and autos

Eric Pachman
Published
October 10th 2024
Eric Pachman
Published
October 10th 2024
This month we have a special US inflation trends update for you! Not only are there a ton of moving parts in today's release to cover, but we also present a scenario analysis of the major drivers of CPI to give you a sense for where CPI could go from here. That said, let's jump into the analysis of today's data before looking ahead.
September 2024 year-over-year inflation comes in nine basis points lower than prior month
This morning the Bureau of Labor Statistics released the September 2024 Consumer Price Index for All Urban Consumers (CPI-U). Overall CPI-U was reported at 2.44% year-over-year (YoY) for September, down just nine basis points from 2.53% year-over-year last month.
As a reminder, Bancreek publishes two visualizations that can help you explore CPI-U in granular detail. Both of these visualizations have now been updated through September and are embedded below:
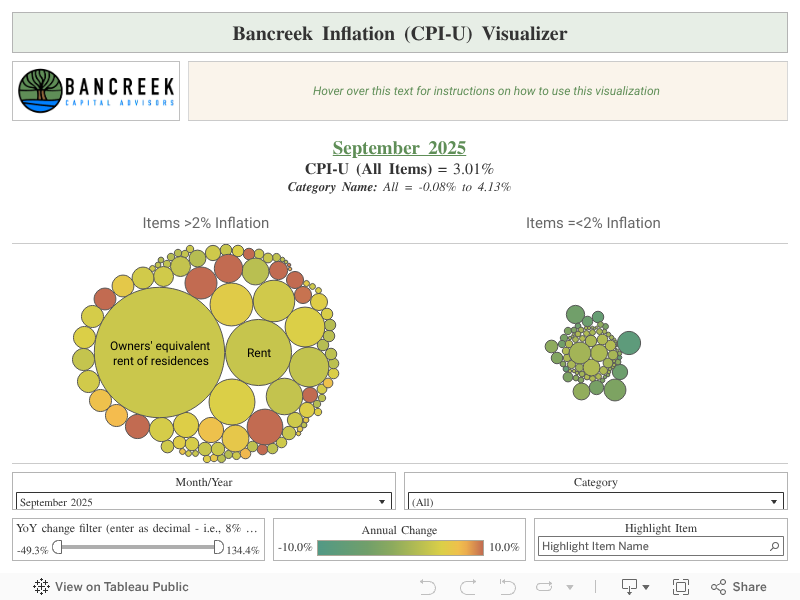
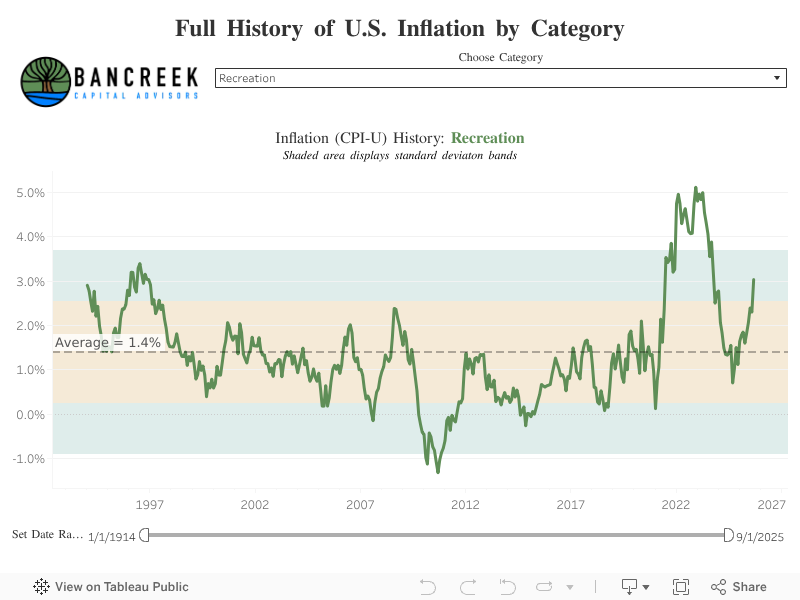
This post hopefully will further assist in your analysis of the moving parts underlying this month’s Consumer Price Index for urban consumers print. Its goal is not to provide a comprehensive analysis of the nearly 180 items we track (that’s what the visualizations are for), but rather just to point to the most meaningful changes from one month to the next.
To perform this analysis, we track a measure we call “inflation impact,” which we calculate by multiplying each item’s YoY inflation by its weight in the prior year period. You can think of this as “weighted inflation” as opposed to the “unweighted inflation” that is more commonly reported by the media. Each month we take the weighted inflation of each item we track in CPI-U and then sum them up to overall CPI-U. Then we compare these weighted inflation numbers from one month to the next to see what drove the sequential increase or decrease. In this way, we can precisely identify the most significant drivers in the change in YoY CPI-U from one month to the next that impacts US inflation trends.
Gasoline pulls down inflation (as expected) but there's a lot more to discuss this month
As we have discussed in recent posts, the gasoline line item in CPI (and PCE) is almost perfectly correlated to change in Daily National Average Gasoline Prices Regular Unleaded, as published by the American Automobile Association (AAA). According to AAA, average retail gasoline prices last month were $3.24 per gallon. One year ago, average prices were $3.84 per gallon. That's a 15.6% YoY decline according to AAA. Today's CPI print showed gasoline prices down 15.3% YoY. So, once again, we have more confirmation that this number is largely known going into the CPI release.
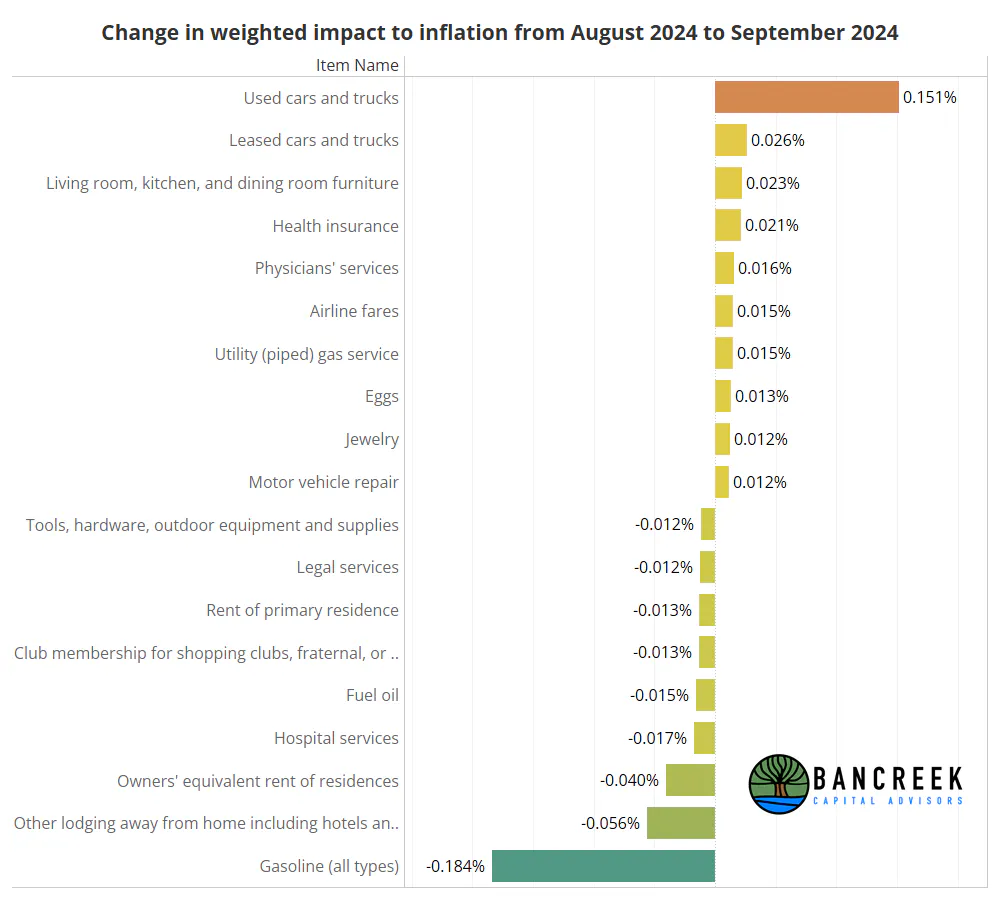
But reporting out that gasoline was down 15.3% YoY is not all that helpful. What's more helpful is to weight this number to tell you that gasoline sliced an eye-popping 55 basis points off inflation this month! In other words, had gasoline prices has been flat YoY, today's inflation print would have been 3%.
Note that the chart below goes one step further than this and compares the weighted inflation for selected items from last month to this month. So, what this is telling you is that the weighted deflationary impact of gasoline shaved an additional 18.4 basis points off inflation in September 2024 when compared to August 2024.
Source: Bancreek Capital Advisors, LLC
Shelter inflation steps down (slightly) from prior months
With gasoline now out of the way, we'll start our exploration of the data where it should always start: Shelter. As a reminder, Owners' equivalent rent of residences ("OER") and Rental of primary residences ("Rent") together comprises 33% of the CPI measure. Think of it this way... let's say you are taking a test. There are ~180 questions on this test. Well, you can think of CPI as a "test" with 180 "questions," except these questions are instead items like eggs, furniture, auto insurance, etc.
Back to the test metaphor. What if we told you that just two of these 180 questions would determine 33% of the grade you received on the test? You would probably work very hard to ensure you answered these questions correctly, right? That's how CPI works. Just two questions determine a third of our "grade." So, it seems appropriate to start here.
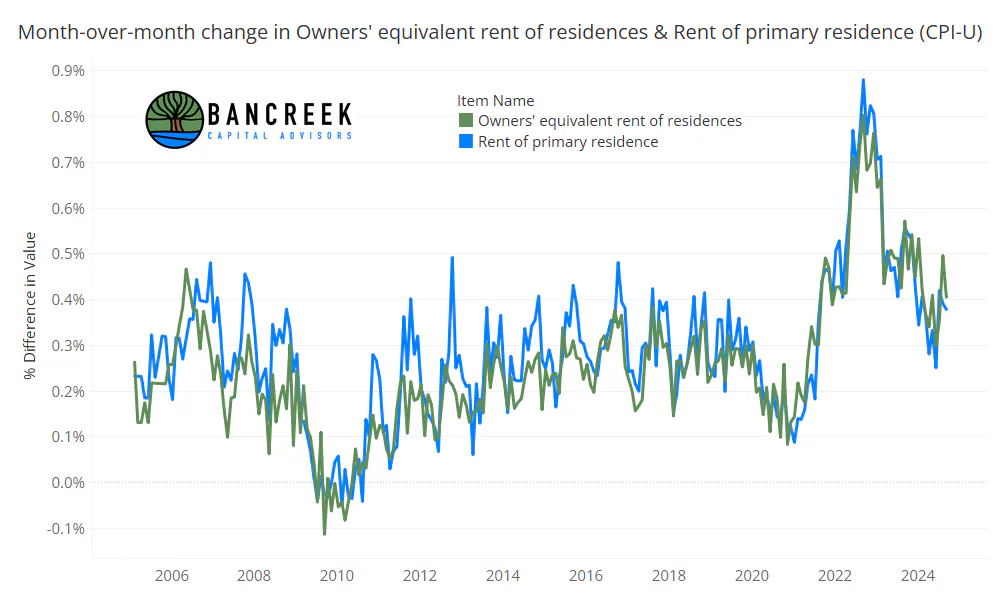
The chart below shows the latest month-over-month inflation for OER and Rents. As shown below, both of these items stepped down from August's inflation rate, with OER rising 40.5 basis points MoM, and Rents rising 37.9 basis points.
Source: Bancreek Capital Advisors, LLC
While this decline in sequential inflation was a relief, it was, in our view, akin to getting punched in the gut a bit lighter than last month. We're relieved that the blows are getting easier to stomach, but as we will show later in this report, we need a lot more progress (and quickly) with these two items to counterbalance inflationary pressures elsewhere.
The unstoppable force that is Motor vehicle insurance
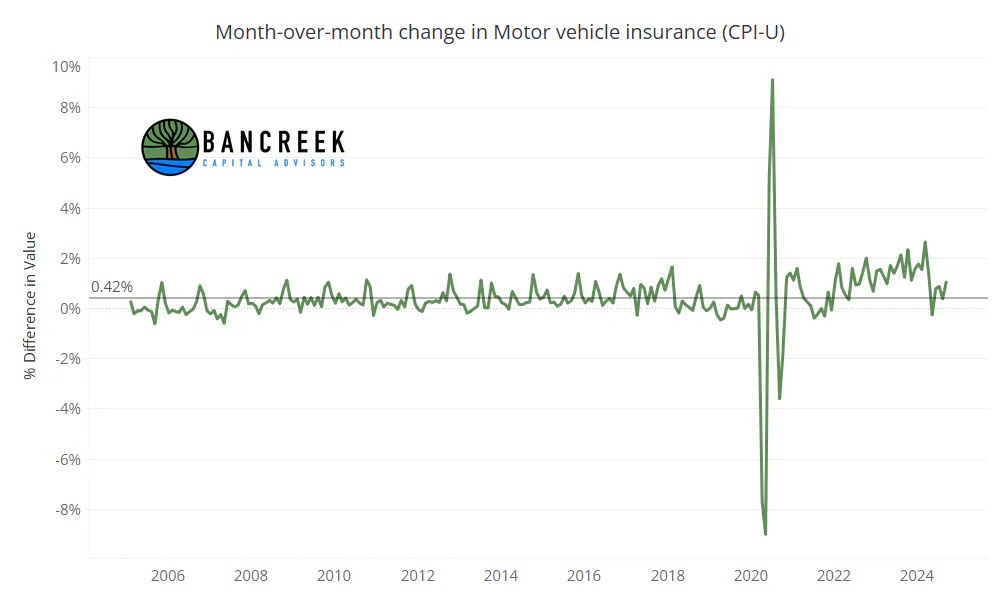
Speaking of punches to the gut, take a look at what Motor vehicle insurance decided to do this month.
Source: Bancreek Capital Advisors, LLC
Motor vehicle insurance once again teased us with a decent month (+39 basis points in August) only to follow that up with a pretty terrible month (+105 basis points in September). You may read elsewhere that YoY motor vehicle insurance declined from 16.5% to 16.3%. And that this is a good thing.
We have a different perspective to offer. You see, if you are following item-level inflation with us, it should start to be getting clear that there is an ebb and flow in inflation for each item. Some items (i.e., Used cars and trucks, Gasoline) will start to cycle very easy comparisons and then pull inflation down. This has essentially been the story of the last two months. But, eventually the comps get more difficult and the deflationary benefit you get from these items erodes. So, we have to look to other items to pick up the slack.
Motor vehicle insurance has been one of the items we have looked to for help for months now as it is facing what should be very easy comps as it cycles massive inflation in 2023. If it were to cooperate and level off on a month-to-month basis, YoY inflation would crater, shaving tens of basis points off inflation. But it's not leveling off. Instead it continues its unprecedented rise, and therefore is not acting as the counterbalance we need to plug the gap for deflationary benefits that are now going away.
Goodbye Used cars and trucks deflation benefit. Thanks for the memories.
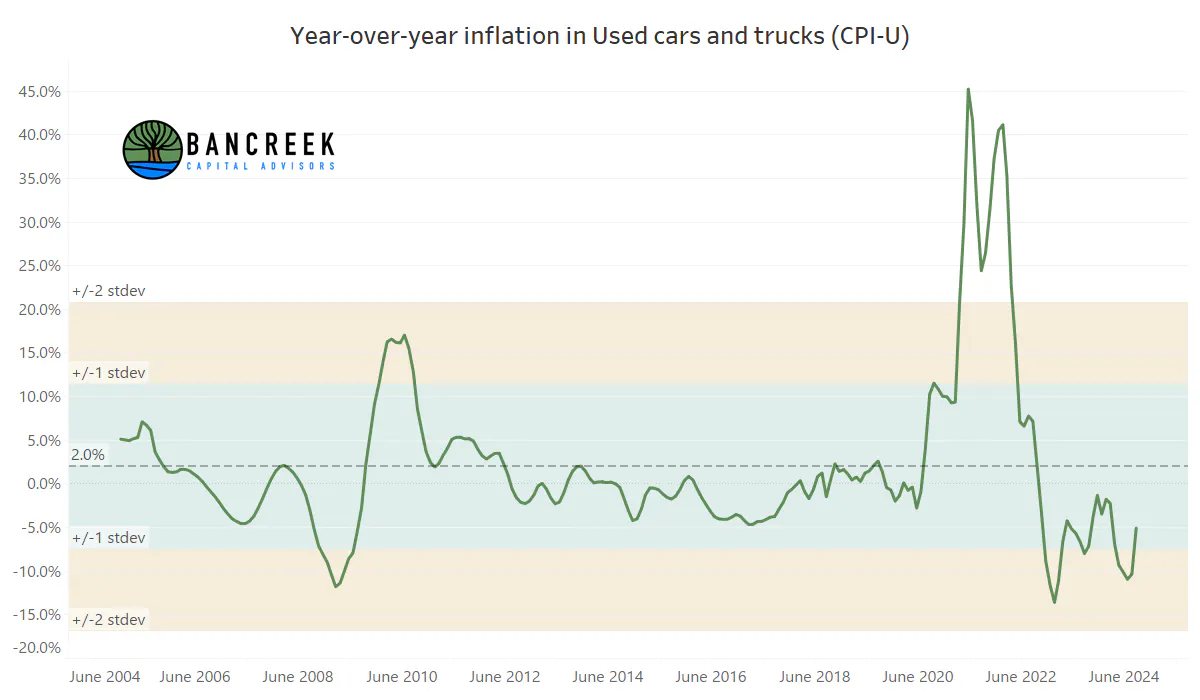
The prime example of this cycling dynamic is what happened this month with Used cars and trucks. On a year-over-year basis, Used cars and trucks went from -10.4% in August 2024 to -5.1% in September 2024. When we weight this change, we calculate that this alone added 15 basis points of YoY inflation to September relative to August CPI.
Source: Bancreek Capital Advisors, LLC
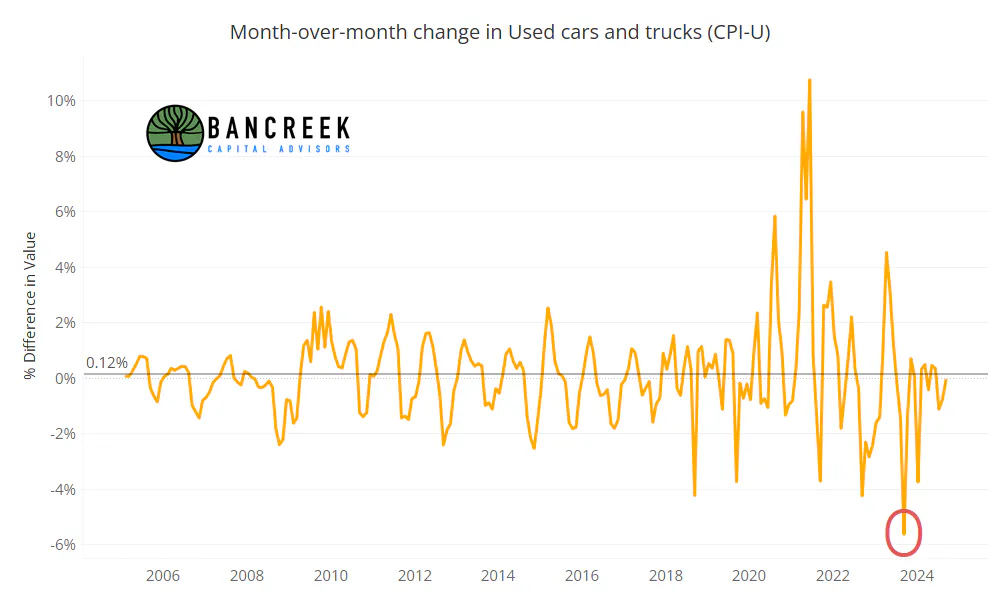
Interestingly, we should have seen this coming, as it had nothing to do with today's new data and really everything to do with last year's data. Take a look at the chart below, which shows the MoM change in Used cars and trucks. This month came in at -0.07%. Nothing to see here really, and no cause for concern, right? But now look again at the chart, instead focusing on the red circle, which shows you the MoM change in this item in September 2023. One year ago, this item declined by -5.63% MoM, posting its single largest monthly drop dating back at least through 2005. In the months leading up to September 2024, YoY inflation calculations didn't yet "see" this correction in September 2023, which led to hefty deflationary prints. Now, the YoY calculation includes last year's correction, which sliced the deflationary benefit coming from this item in half in just one month.
Source: Bancreek Capital Advisors, LLC
Hopefully you are now starting to understand that inflation analytics is about much more than just studying the latest set of index values each month. Sometimes information we already have can provide insight that can help us see a bit more clearly into the future. We're making our way to this discussion, but before we do, we have a few more items to cover.
Health insurance is back to "normal"
Earlier this year we called out the abnormality in health insurance deflation that artificially lowered CPI through 2023. Again, it didn't require a crystal ball to look forward and see that if the monthly index values were stabilizing (or rising), eventually Health insurance's YoY deflation benefit would fade away into the sunset. Here we are several months later, and sadly, this has happened.
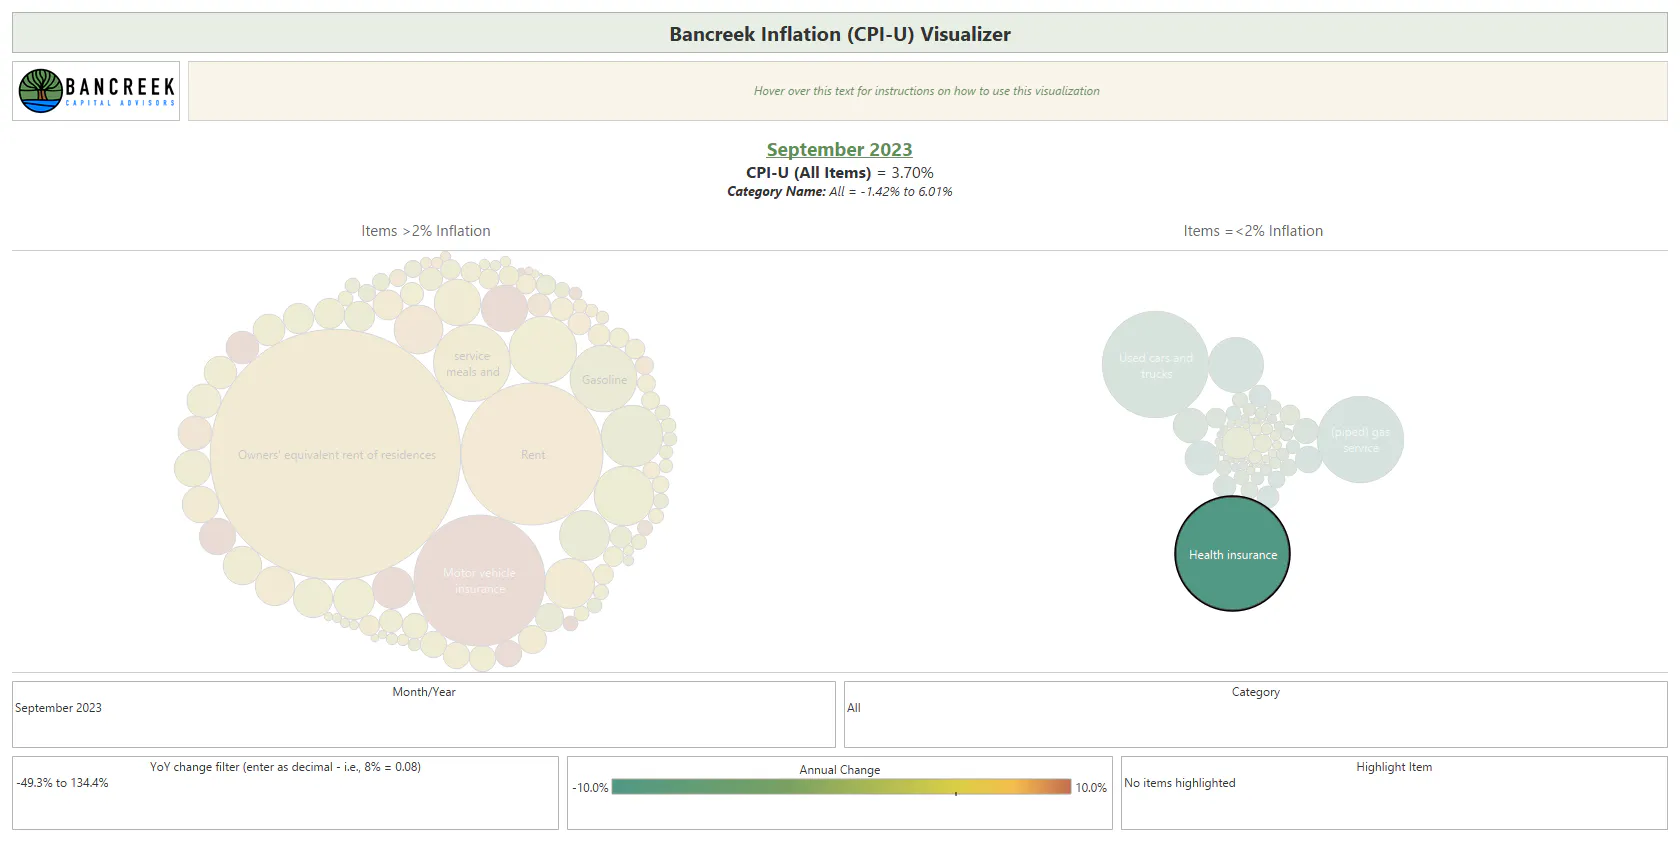
There's probably no more visceral way to experience this than through our visualization (although, we are admittedly biased on this topic). First, check out our CPI bubble chart one year ago. Note that we have highlighted Health insurance so you don't have to hunt for it. In September 2023, Health insurance was the single largest deflationary contributor to US inflation trends, slicing 34 basis points off YoY CPI in the month.
Source: Bancreek Capital Advisors, LLC
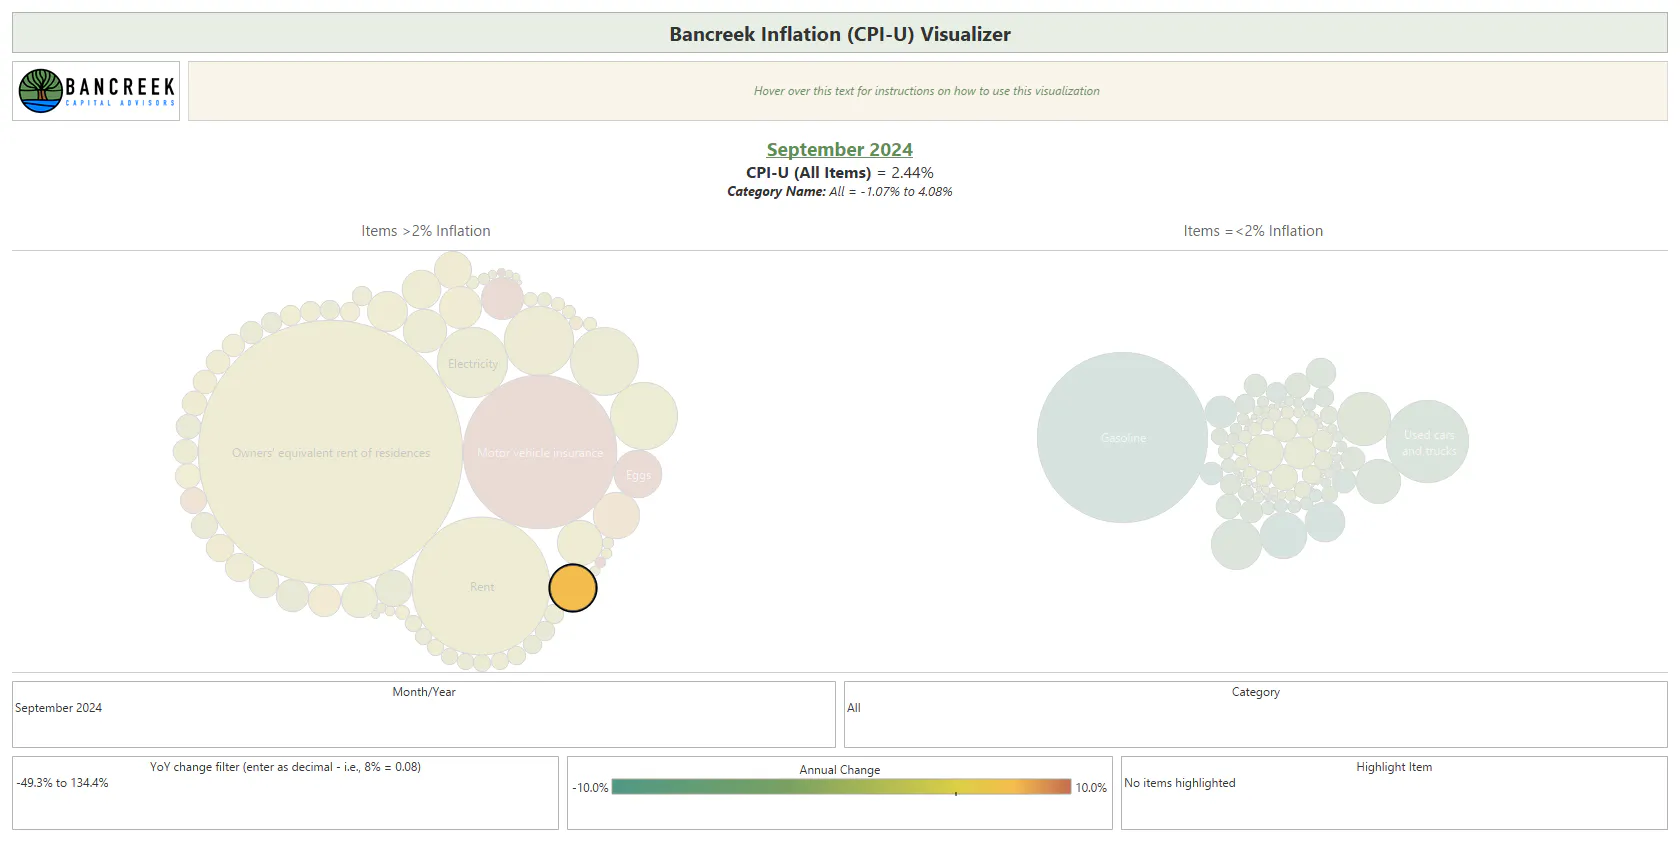
Now fast forward one year to the same visualization of today's data. Health insurance switched teams on us... now it's +7.5% YoY, and adding 4 basis points to inflation.
Source: Bancreek Capital Advisors, LLC
Four basis points may not seem like a lot, but it's not about the absolute numbers, but rather the change that matters. Over the last year, this one item has provided a nearly 40 basis point headwind to inflation. The question is who else is going to step up to offset this?
Lodging away from home helps, but is too volatile to count on going forward
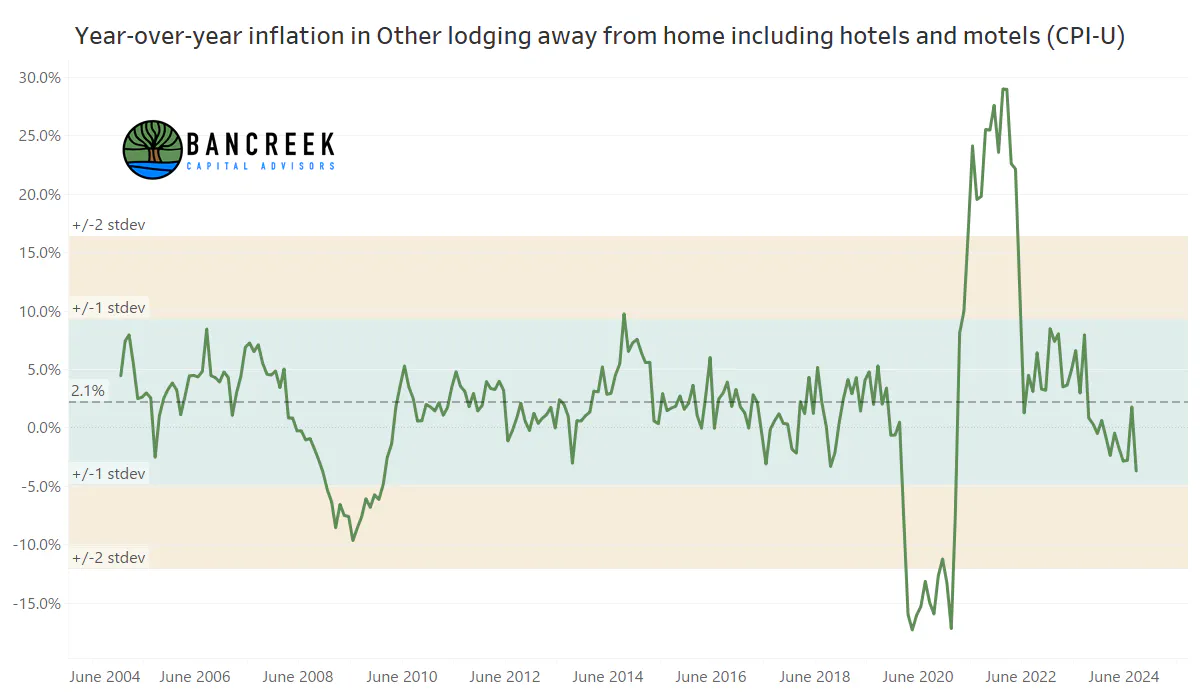
Maybe the answer is Lodging away from home, which declined -3.7% YoY in September. When we weight this item, it sliced over five basis points off YoY CPI when compared to August 2024.
Source: Bancreek Capital Advisors, LLC
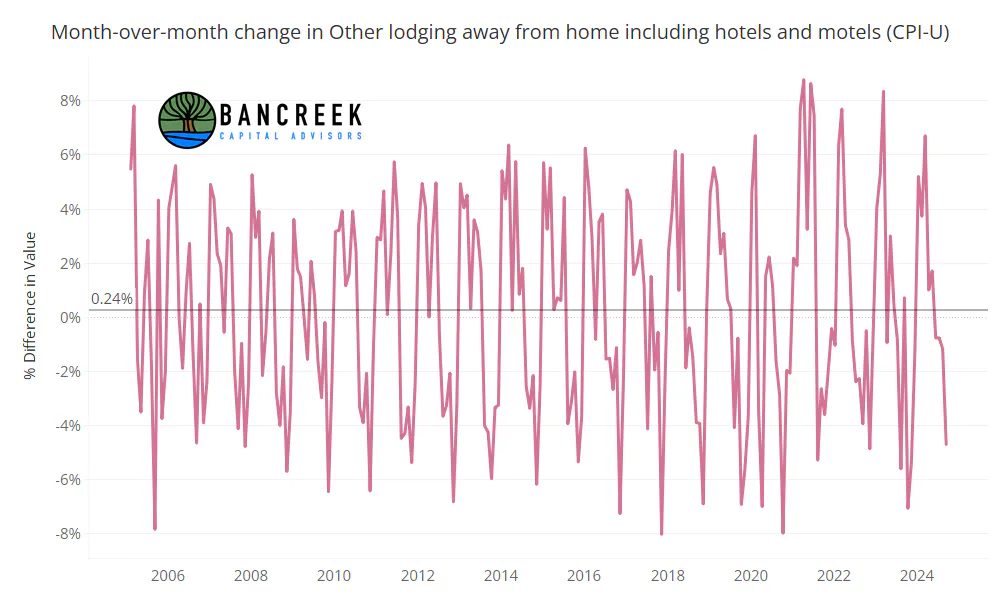
But our hopes that hotel and motel deflation will lead the way to prosperity quickly dissipate when we are confronted with this next chart, which shows MoM sequential inflation for the item.
Source: Bancreek Capital Advisors, LLC
The above chart makes it quite clear that it is in the nature of this item to swing back and forth wildly. This month's CPI benefitted from a downward move in the series, but unless the fundamental nature of hotel and motel pricing changes, we shouldn't expect this item to reliably come to CPI's rescue going forward. This item is more like Venom than Spiderman. It's a conflicted character who will show up and do some good things every now and again, but then also eat a bunch of people when it gets hungry.
3.2% MoM inflation in... furniture?
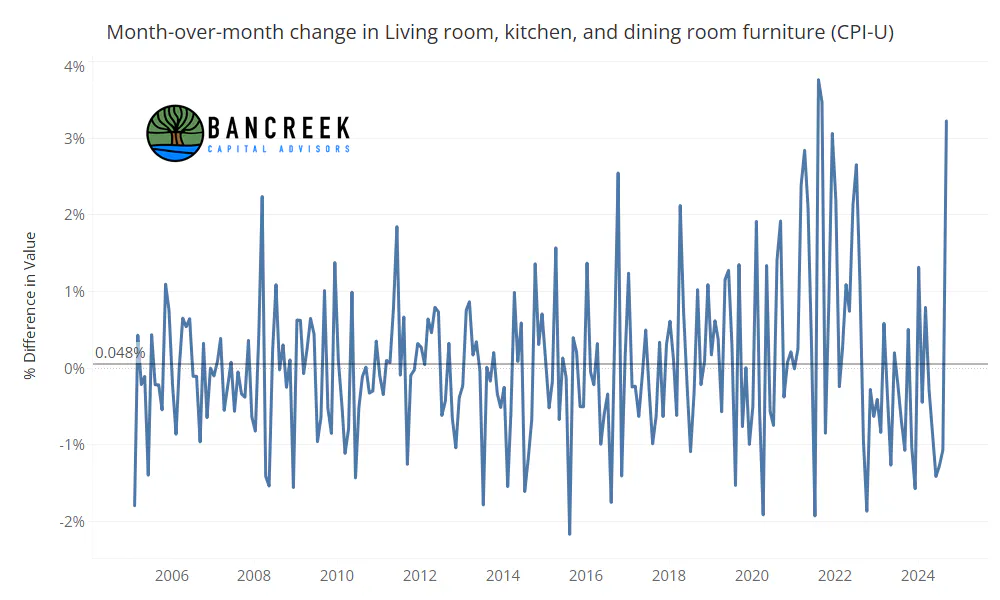
We'll wrap up our tour of the today's data with an odd data point: Living room, kitchen, and dining room furniture inflated sequentially by 3.2%. That's the second highest MoM inflation on record for this item.
Source: Bancreek Capital Advisors, LLC
As far as an explanation for this. Well, we got nothing. The internet is notably silent on a living room furniture shortage that we could conveniently blame for this price movement. Instead, we'll remind you that the CPI data oftentimes should be interpreted as just data, and nothing more. Some items like gasoline (as we discussed earlier) have a very solid and traceable basis in reality. Others (like furniture) ostensibly descend down from the BLS heavens onto our computers. That's the way this works. We've found it's easiest to just accept the unknown with many of these items, rather than looking for an explanation, and move on.
The Main Event: Where we go from here depends on homes and autos
As we started to click away at the keyboard we had a chuckle or two that the entire fate of CPI (and PCE for that matter, although we will save those estimates for a future post) boils down to homes and autos. Why is this funny? Because we couldn't stop thinking about that State Farm commercial where Travis Kelce was asked to change his last name to MaAutos, so he and Patrick Mahomes could be referred to as Mahomes and MaAutos going forward. Now that this funny commercial is stuck in your head, hopefully it will lighten the mood a bit as we delve into a decidedly unfunny story.
Just five items appear to control our fate in the coming months
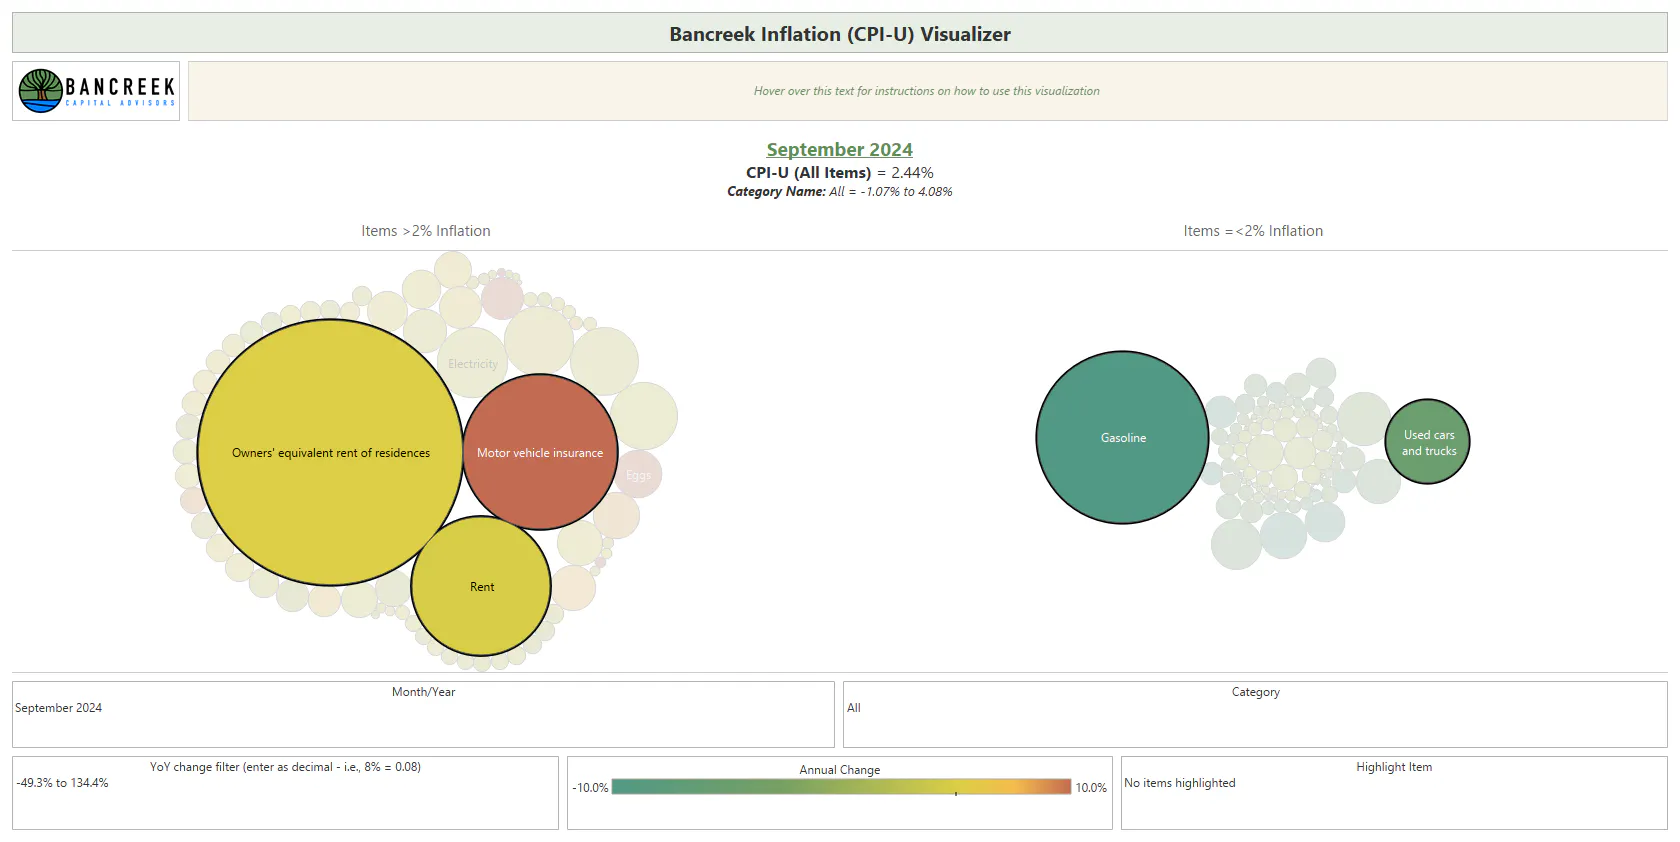
When we step back and look at our inflation visualization, it becomes clear that there are five items that stand out from all the rest. We've highlighted them for you in the following image and then listed them below the image, along with their team affiliation just so there is no confusion.
Source: Bancreek Capital Advisors, LLC
Five items control CPI's near-term destiny
- OER (homes)
- Rent (homes)
- Gasoline (autos)
- Used cars and trucks (autos)
- Motor vehicle insurance (autos)
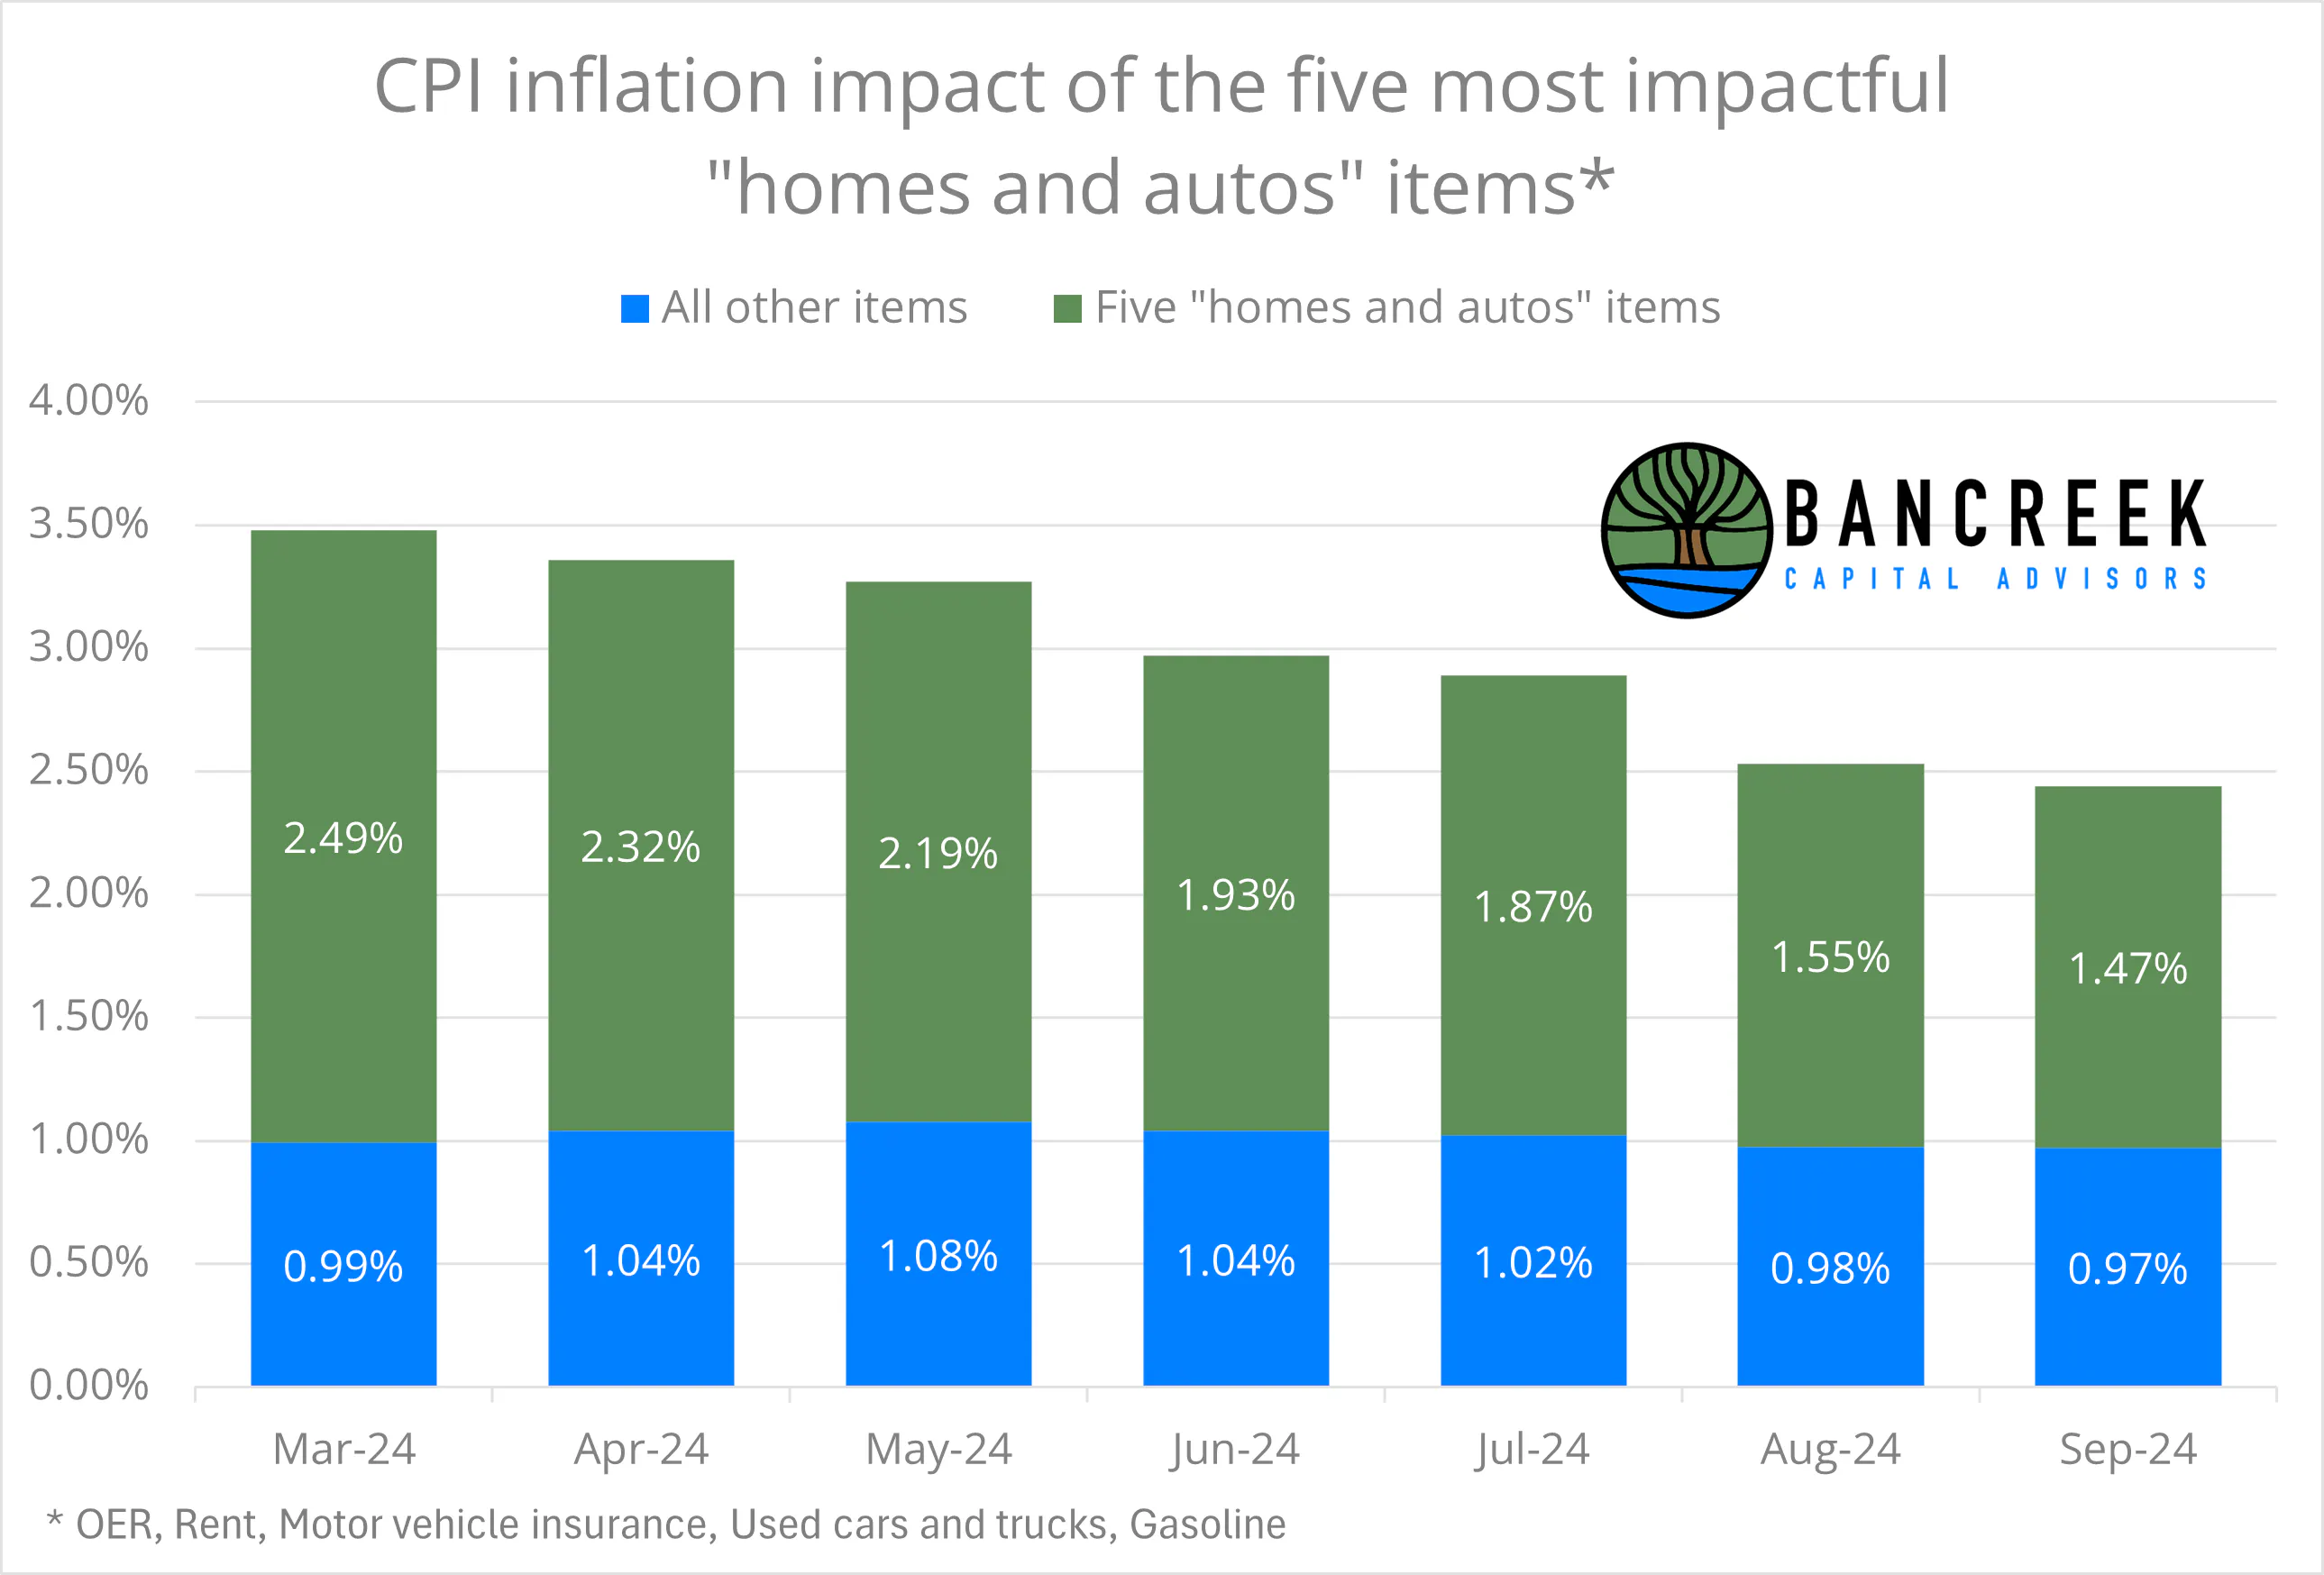
Interestingly, if we look back to March 2024, it has been these five items that have, net, driven essentially all the change in YoY CPI from one month to the next. The next chart makes that crystal clear, showing that the other ~175 items have, when all netted together, had a highly stable inflation impact over the past few months. In fact, its been right around 1%, plus or minus ~5 basis points. In other words, since March the vast majority of items have formed a base 1% inflation within CPI. Meanwhile, all the action has been in the other five items.
Source: Bancreek Capital Advisors, LLC
This is quite convenient for modeling purposes, as it allows us to focus our attention on just these five homes and autos items. Of course, something could change to completely invalidate this assumption (such as continued health insurance inflation, or an actual furniture shortage), but for simplicity sake, we will just assume all of these items remain pinned at 1% going forward just to illustrate the impact that these five items could have on CPI going forward.
Team autos should provide a headwind to CPI in the coming months
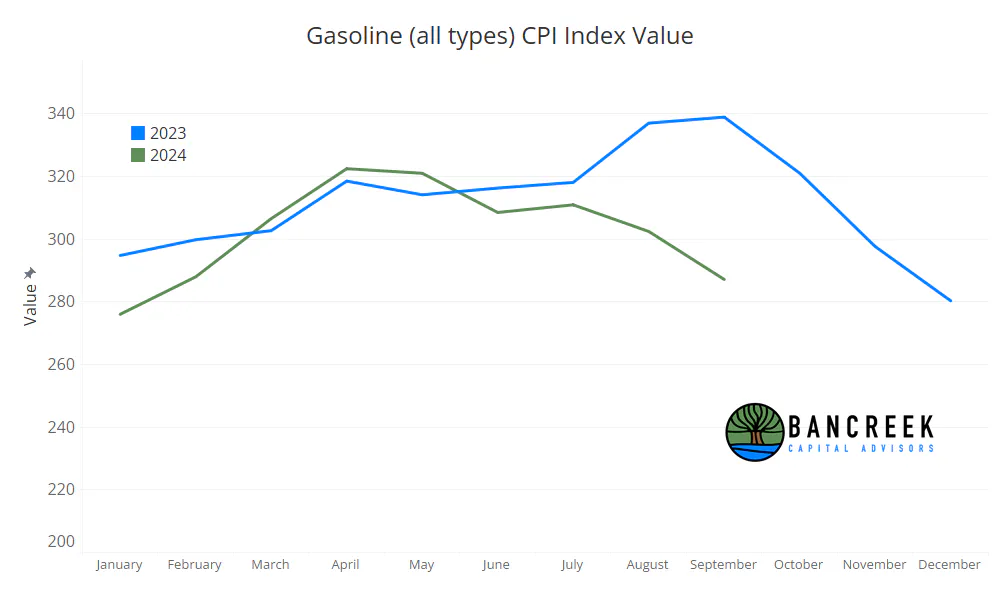
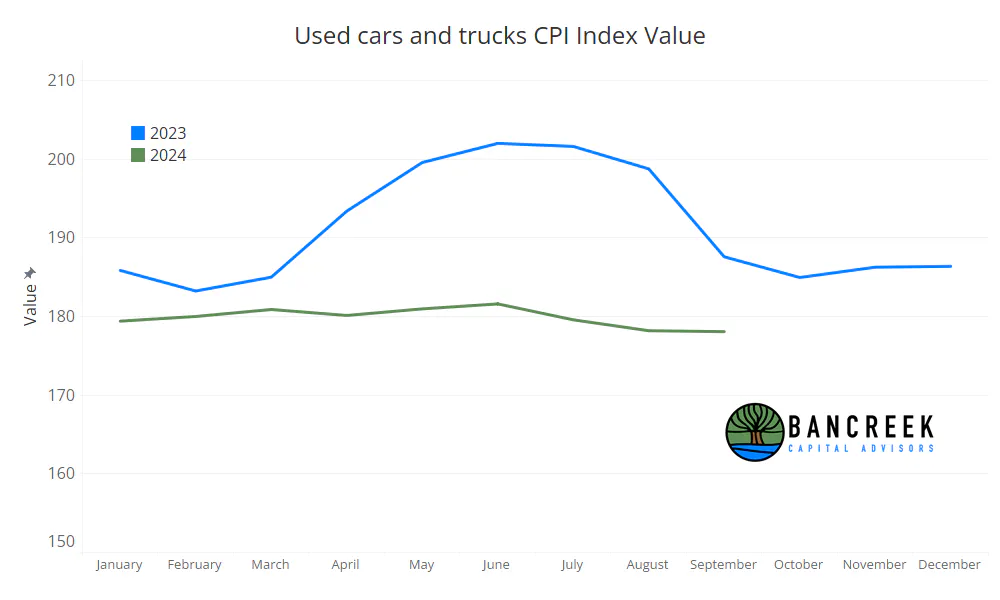
The story for two of the three members of Team autos is just one of cycling tougher comps. As shown in the following two charts, comparisons for both Used cars and trucks and Gasoline get considerably more difficult as we head into year-end.
Source: Bancreek Capital Advisors, LLC
Source: Bancreek Capital Advisors, LLC
The above gasoline chart makes it quite clear that if we don't see any further decline in gasoline prices in the coming months, gasoline will be an inflationary item by December. The Used cars and trucks outlook (assuming the index values stabilize at September levels) looks a bit better through year-end, with us forecasting -4.5% deflation in this item in December. But look at the drop off from December 2023 to January 2024. Let's not sleep on this, as we are going to have to cycle it come January 2025! If we don't decline much from where we are today, all deflation benefit from Used cars and trucks will be gone by January 2025.
If we put these two items together and simply assume they both stabilize at current levels, we would expect them to add eight basis points to inflation in January 2025. That may seem innocuous, until you realize that these two reduced this month's CPI by a whopping -68 basis points! So, unless something else steps in to assist, we could add three-quarters of a point to today's CPI print in just four months.
Homes to the rescue?
But the outcome is unlikely to be that bad, as we are currently undergoing a glacially slow return to more normal inflation rates for the key shelter items: OER and Rent. It’s undeniable that, as one-third of the CPI measure, these two items wield unparalleled power in determining the fate of CPI. The problem has been that they have been extremely stubborn, refusing to break meaningfully and sustainably below 40 basis points of MoM inflation. 40 basis points may not seem terrible considering that just two years ago they were both hovering around double that level. But the Fed wants visibility to 2% inflation, and mathematically it is extremely difficult to get there without MoM shelter inflation lower than this.
Consider the following scenarios for OER over the next four months:
- OER comes in at 30 basis points of MoM inflation each month. In January 2025, YoY OER inflation would be 4.4%, down from 5.2% today. OER's inflation impact would be 1.13%, shaving 21 basis points off headline CPI,
- OER comes in at 40 basis points of MoM inflation each month. In January 2025, YoY OER inflation would be 4.8%, down from 5.2% today. OER's inflation impact would be 1.23%, shaving nine basis points off headline CPI,
- OER comes in at 50 basis points of MoM inflation each month. In January 2025, YoY OER inflation would be 5.2%, equal to 5.2% today. OER's inflation impact would be 1.34%, shaving zero basis points off headline CPI.
It’s difficult to predict which of these scenarios will play out, especially now that the rate-lowering cycle has begun, adding even more complexity to the forecast. But the point is that even in a really great scenario (only 30 basis points of inflation), we still should only expect OER to generate 21 basis points of improvement to CPI. If we assume Rent follows the same path, that would add another five basis points of favorability. Taken together, even in this very "good" scenario these two heavyweights only offset one-third of the expected inflationary impact from Team auto.
Which team is Motor vehicle insurance really playing for?
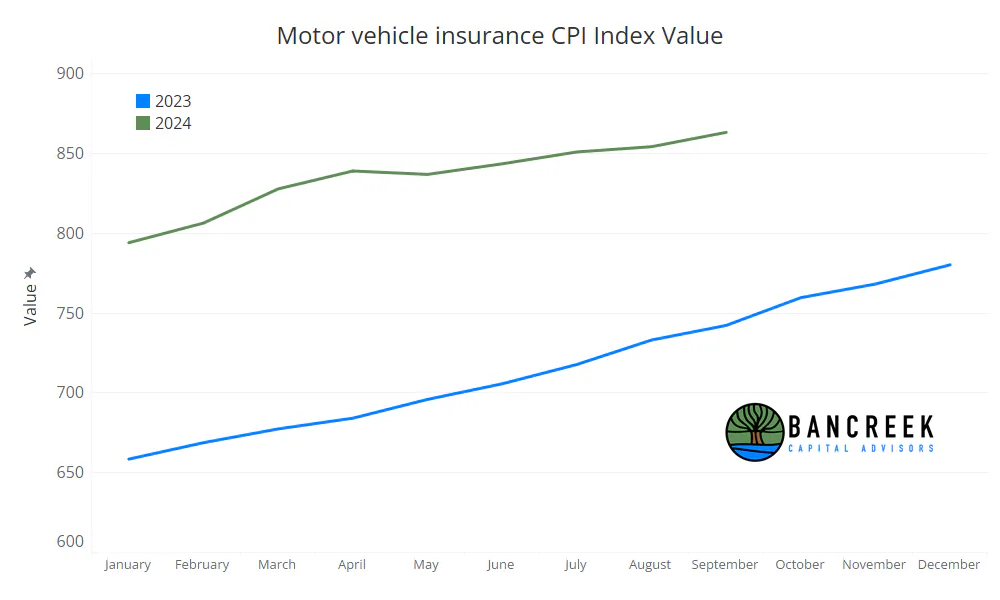
If we continue our homes vs. autos metaphor, Motor vehicle insurance is clearly playing for the wrong team. It is highly likely, in our view, that it will help inflation (like Team homes) going forward rather than hurt it (like Team autos). But, Motor vehicle insurance is not even close to living up to its altruistic potential. Looking simply at the comparisons (as shown below) this one item looked like it had the potential to dramatically reduce inflation in late-2024 and early-2025. All it needed to do was slow its sequential growth (as it did in May) and the YoY inflation rate was bound to precipitously decline.
Source: Bancreek Capital Advisors, LLC
But Motor vehicle insurance has instead thumbed its nose at our expectations, continuing to rise at a rapid clip sequentially, impairing the most obvious hope to offset the headwinds that Team autos is likely to create going forward.
To really hammer this home, consider that Motor vehicle insurance added 45 basis points of inflation to today's CPI print. Let's say there was some alternate universe where starting at the beginning of the year, this item returned to its historical average MoM growth rate of 0.42%. September's YoY inflation for the item would have been 9.2% instead of 16.3%. This would have equated to an inflation impact of 25 basis points, 20 basis points lower than it actually was this month. If we run rate this alternate universe through January 2025, Motor vehicle insurance's inflation impact drops to just 10 basis points, which would have been enough to offset the vast majority of the headwind from Team autos.
But we don't live in that universe. We live in the universe where Motor vehicle insurance faces no gravitational pull. Even if starting next month its sequential inflation did drop to 0.42%, Motor vehicle insurance will still add 29 basis points to inflation in January 2025. Meanwhile, if it stays elevated at, say, +80 basis points per month, we expect the item to add 34 basis points to inflation in January 2025. Note that either scenario is lower than what we are experiencing today, but not by nearly enough to offset the headwinds we see in the distance.
Putting it all together - the path of least resistance for CPI over next few months is up (before potentially improving)
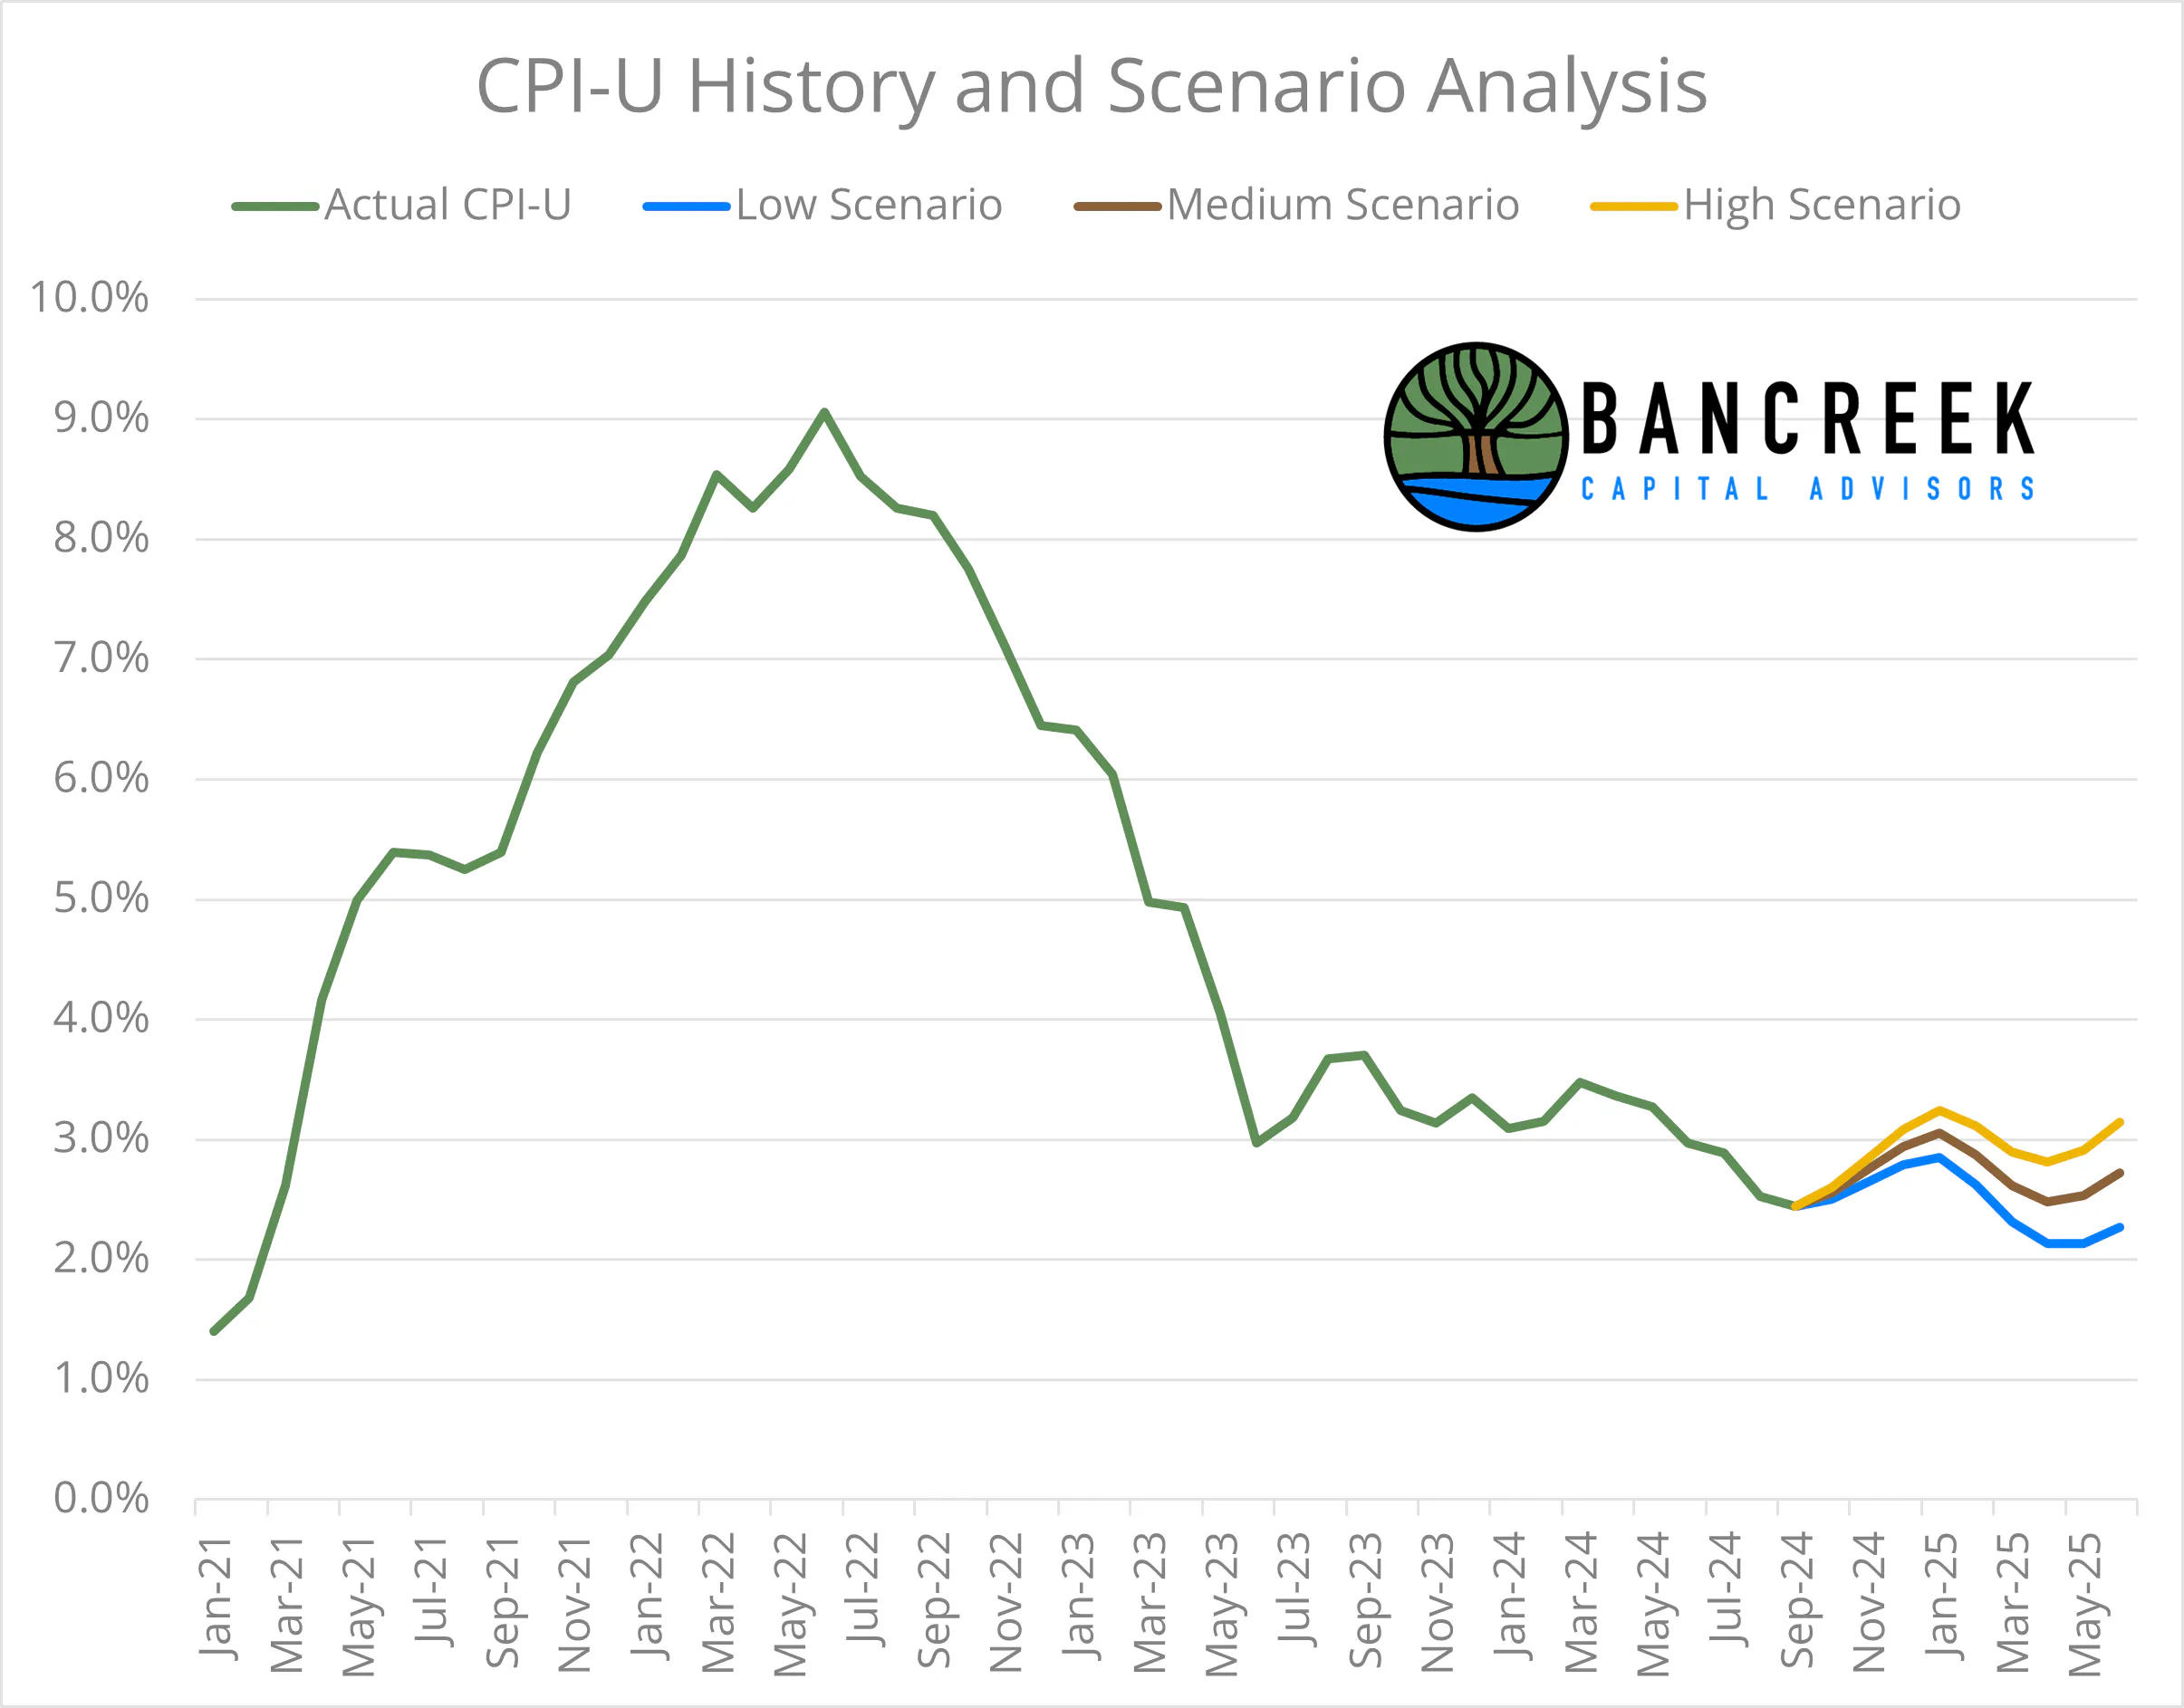
Assuming you’re still with us after this (admittedly) heavy-lift of a read, it’s time for your reward: our scenario analysis of CPI for the months ahead. To do so, we first need to create three scenarios, which we'll call Low, Medium, and High. Here's the assumptions we are using for each of these three scenarios:
Low Inflation Scenario
- OER and Rents rise by 30 basis points MoM each month
- Used cars and trucks continues to decline by -10 basis points MoM each month
- Motor vehicle insurance rises by 42 basis points (its historical average) MoM each month
- Gasoline declines by -1.3% MoM in October to get to the current October average as of 10/9, and then rises by its historical average (+47 basis points MoM) each month in November forward
- All other items net to 1% weighted inflation
Medium Inflation Scenario
- OER and Rents rise by 40 basis points MoM each month
- Used cars and trucks rises by 12 basis points MoM each month (its historical average)
- Motor vehicle insurance rises by 75 basis points MoM each month
- Gasoline declines by -1.3% MoM in October to get to the current October average as of 10/9, and then rises by its historical average (+47 basis points MoM) each month in November forward
- All other items net to 1% weighted inflation
High Inflation Scenario
- OER and Rents rise by 50 basis points MoM each month
- Used cars and trucks rises by 30 basis points MoM each month
- Motor vehicle insurance rises by 100 basis points MoM each month
- Gasoline declines by -1.3% MoM in October to get to the current October average as of 10/9, and then rises by its historical average (+47 basis points MoM) each month in November forward
- All other items net to 1% weighted inflation
Please note that we decided to use the same assumption for sequential gasoline inflation in each scenario, simply because we believe forecasting gasoline prices to be a fool's errand. Moreover, the swings to inflation associated with gasoline prices are wild, and can distract from the true purpose of this modeling exercise, which is to better understand the path of inflation going forward using three reasonable scenarios. As such, each scenario accounts adjusts gasoline prices for what has happened so far in October (through 10/9) and then grows the index at its historical average rate going forward.
That said, we are finally ready to unveil the results of this modeling exercise:
Source: Bancreek Capital Advisors, LLC
Here are our key takeaways from our modeling work:
- First, the range of outcomes over the next few months are pretty narrow. For example, we see January 2025 ranging from 2.9% to 3.2%. That's a tight band, and far higher than the 2.4% we saw today. This just reinforces our assertion earlier that improvements to shelter inflation can't reverse out the headwinds we will likely see from Team auto.
- Next, beyond January 2025, the range of outcomes widens out considerably. Our model sees inflation in April 2025 ranging from a low of 2.1% to a high of 2.8%. That's a very wide gap that would almost certainly result in different monetary policy decisions.
- Last, after ebbing in the spring, all three scenarios show inflation accelerating into next summer. Remember, all three scenarios fix the sequential inflation for the key items we have chosen to model, so this oscillation is completely driven by cycling of prior year comparisons.
All models are wrong. Some are useful.
Our goal in presenting the results of this modeling exercise is not to be "right." At Bancreek Capital Advisors, our business is to offer data-driven investment portfolios, not to be economists.. But we love working with data, and the more complex the data set the better. That's why we offer analysis and data visualizations on macro topics like inflation and jobs. We would do this work regardless out of curiosity, so why not try to be helpful and offer it to the broader public in hopes that they use it to make more educated investment decisions!
As such, we hope that this modeling exercise has been useful in understanding the key drivers of inflation going forward, and getting a better feel of the magnitude of an impact they could have. Feel free to reach out to us with any questions or comments.
Enjoying this post?
Tell others about it.

Bancreek's Actively Managed ETFs
If you are interested in learning more about Bancreek Capital Advisors' actively managed ETFs click the link below
Learn MoreMore articles like this
Fetching Related Posts
There are no other articles tagged with Research
