
Key takeaways from the July 2024 Personal Consumption Expenditures release

Eric Pachman
Published
August 30th 2024
Eric Pachman
Published
August 30th 2024
July 2024 year-over-year PCE comes in three basis points higher than prior month
This morning the Bureau of Economic Analysis released July 2024 Personal Consumption Expenditures (PCE) data. Overall PCE was reported at 2.50% year-over-year (YoY) for July, up three basis points from 2.47% year-over-year last month.
As a reminder, Bancreek publishes two visualizations that can help you explore PCE in granular detail. Both of these visualizations have now been updated through July and are embedded below:


This post hopefully will further assist in your analysis of the moving parts underlying this month’s PCE print. Its goal is not to provide a comprehensive analysis of the more than 180 items we track (that’s what the visualizations are for), but rather just to point to the most meaningful changes from one month to the next.
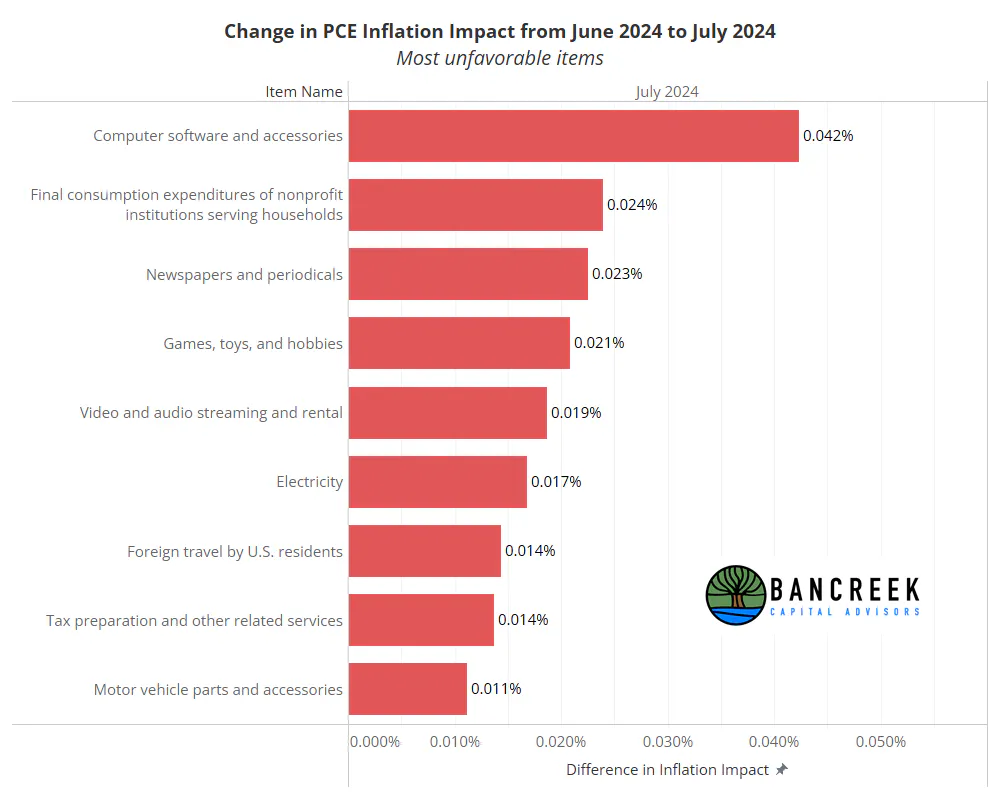
To perform this analysis, we track a measure we call “inflation impact,” which we calculate by multiplying each item’s YoY inflation by its weight in the prior year period. You can think of this as “weighted inflation” as opposed to the “unweighted inflation” that is more commonly reported by the media. Each month we take the weighted inflation of each item we track in PCE and then sum them up to overall PCE. Then we compare these weighted inflation numbers from one month to the next to see what drove the sequential increase or decrease. In this way, we can precisely identify the most significant drivers in the change in YoY PCE from one month to the next.
Computer software and accessories drives the slight rise in inflation in July
When we calculate YoY inflation impacts for all items and compare them from June to July, one item stands above the rest: Computer software and accessories.
Source: Bancreek Capital Advisors, LLC
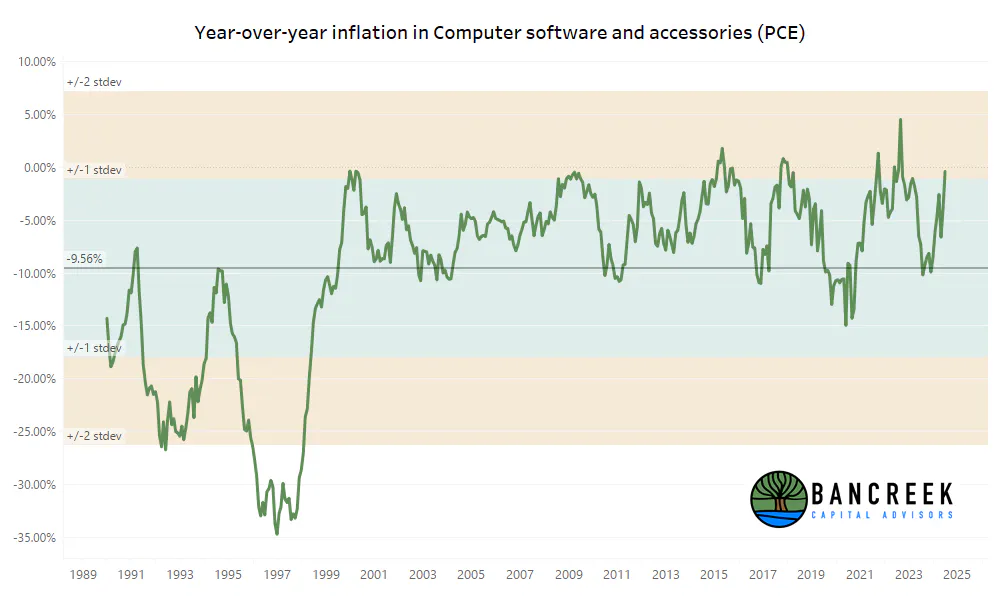
This is nothing to get worried about in our view. Much like televisions, this item has exhibited structural deflation... well... for the entire history of the data! Take a look at the below chart, which shows that this item has averaged nearly 10% YoY deflation since 1990.
Source: Bancreek Capital Advisors, LLC
Against this backdrop, July's -0.39% deflation (up from -3.92% in June) is somewhat anomalous. But aside from a few months, there is no historical precedent for it getting much "worse" than where it is now. So, there's a high probability this will be the first and last time we'll have to write about this item, at least on the unfavorable side of the ledger.
Broad collection of favorable items largely offset unfavorable items
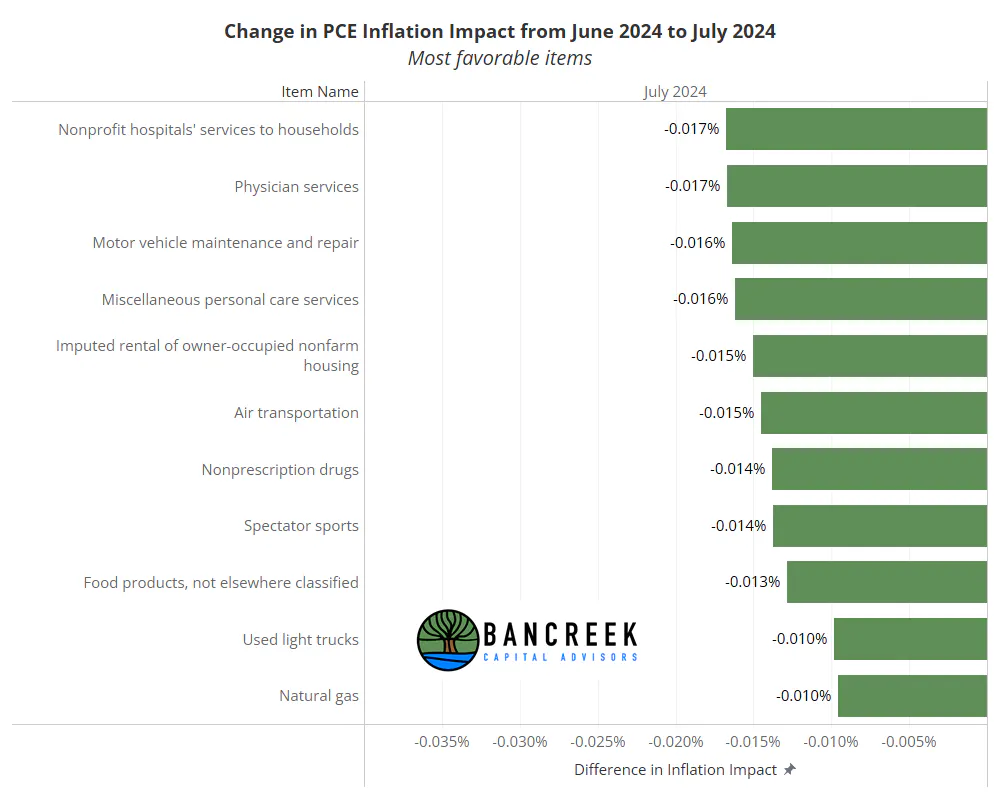
Moving to the favorable side of the ledger, we count 11 different items that reduced July's YoY inflation by more than one basis point when compared to June. However, there were no items that had more than a two basis point incremental favorable impact. Since nothing really stands out enough to call out, we'll provide the chart below for your viewing pleasure and move on.
Source: Bancreek Capital Advisors, LLC
Could next month's PCE print drop to 2.2%?
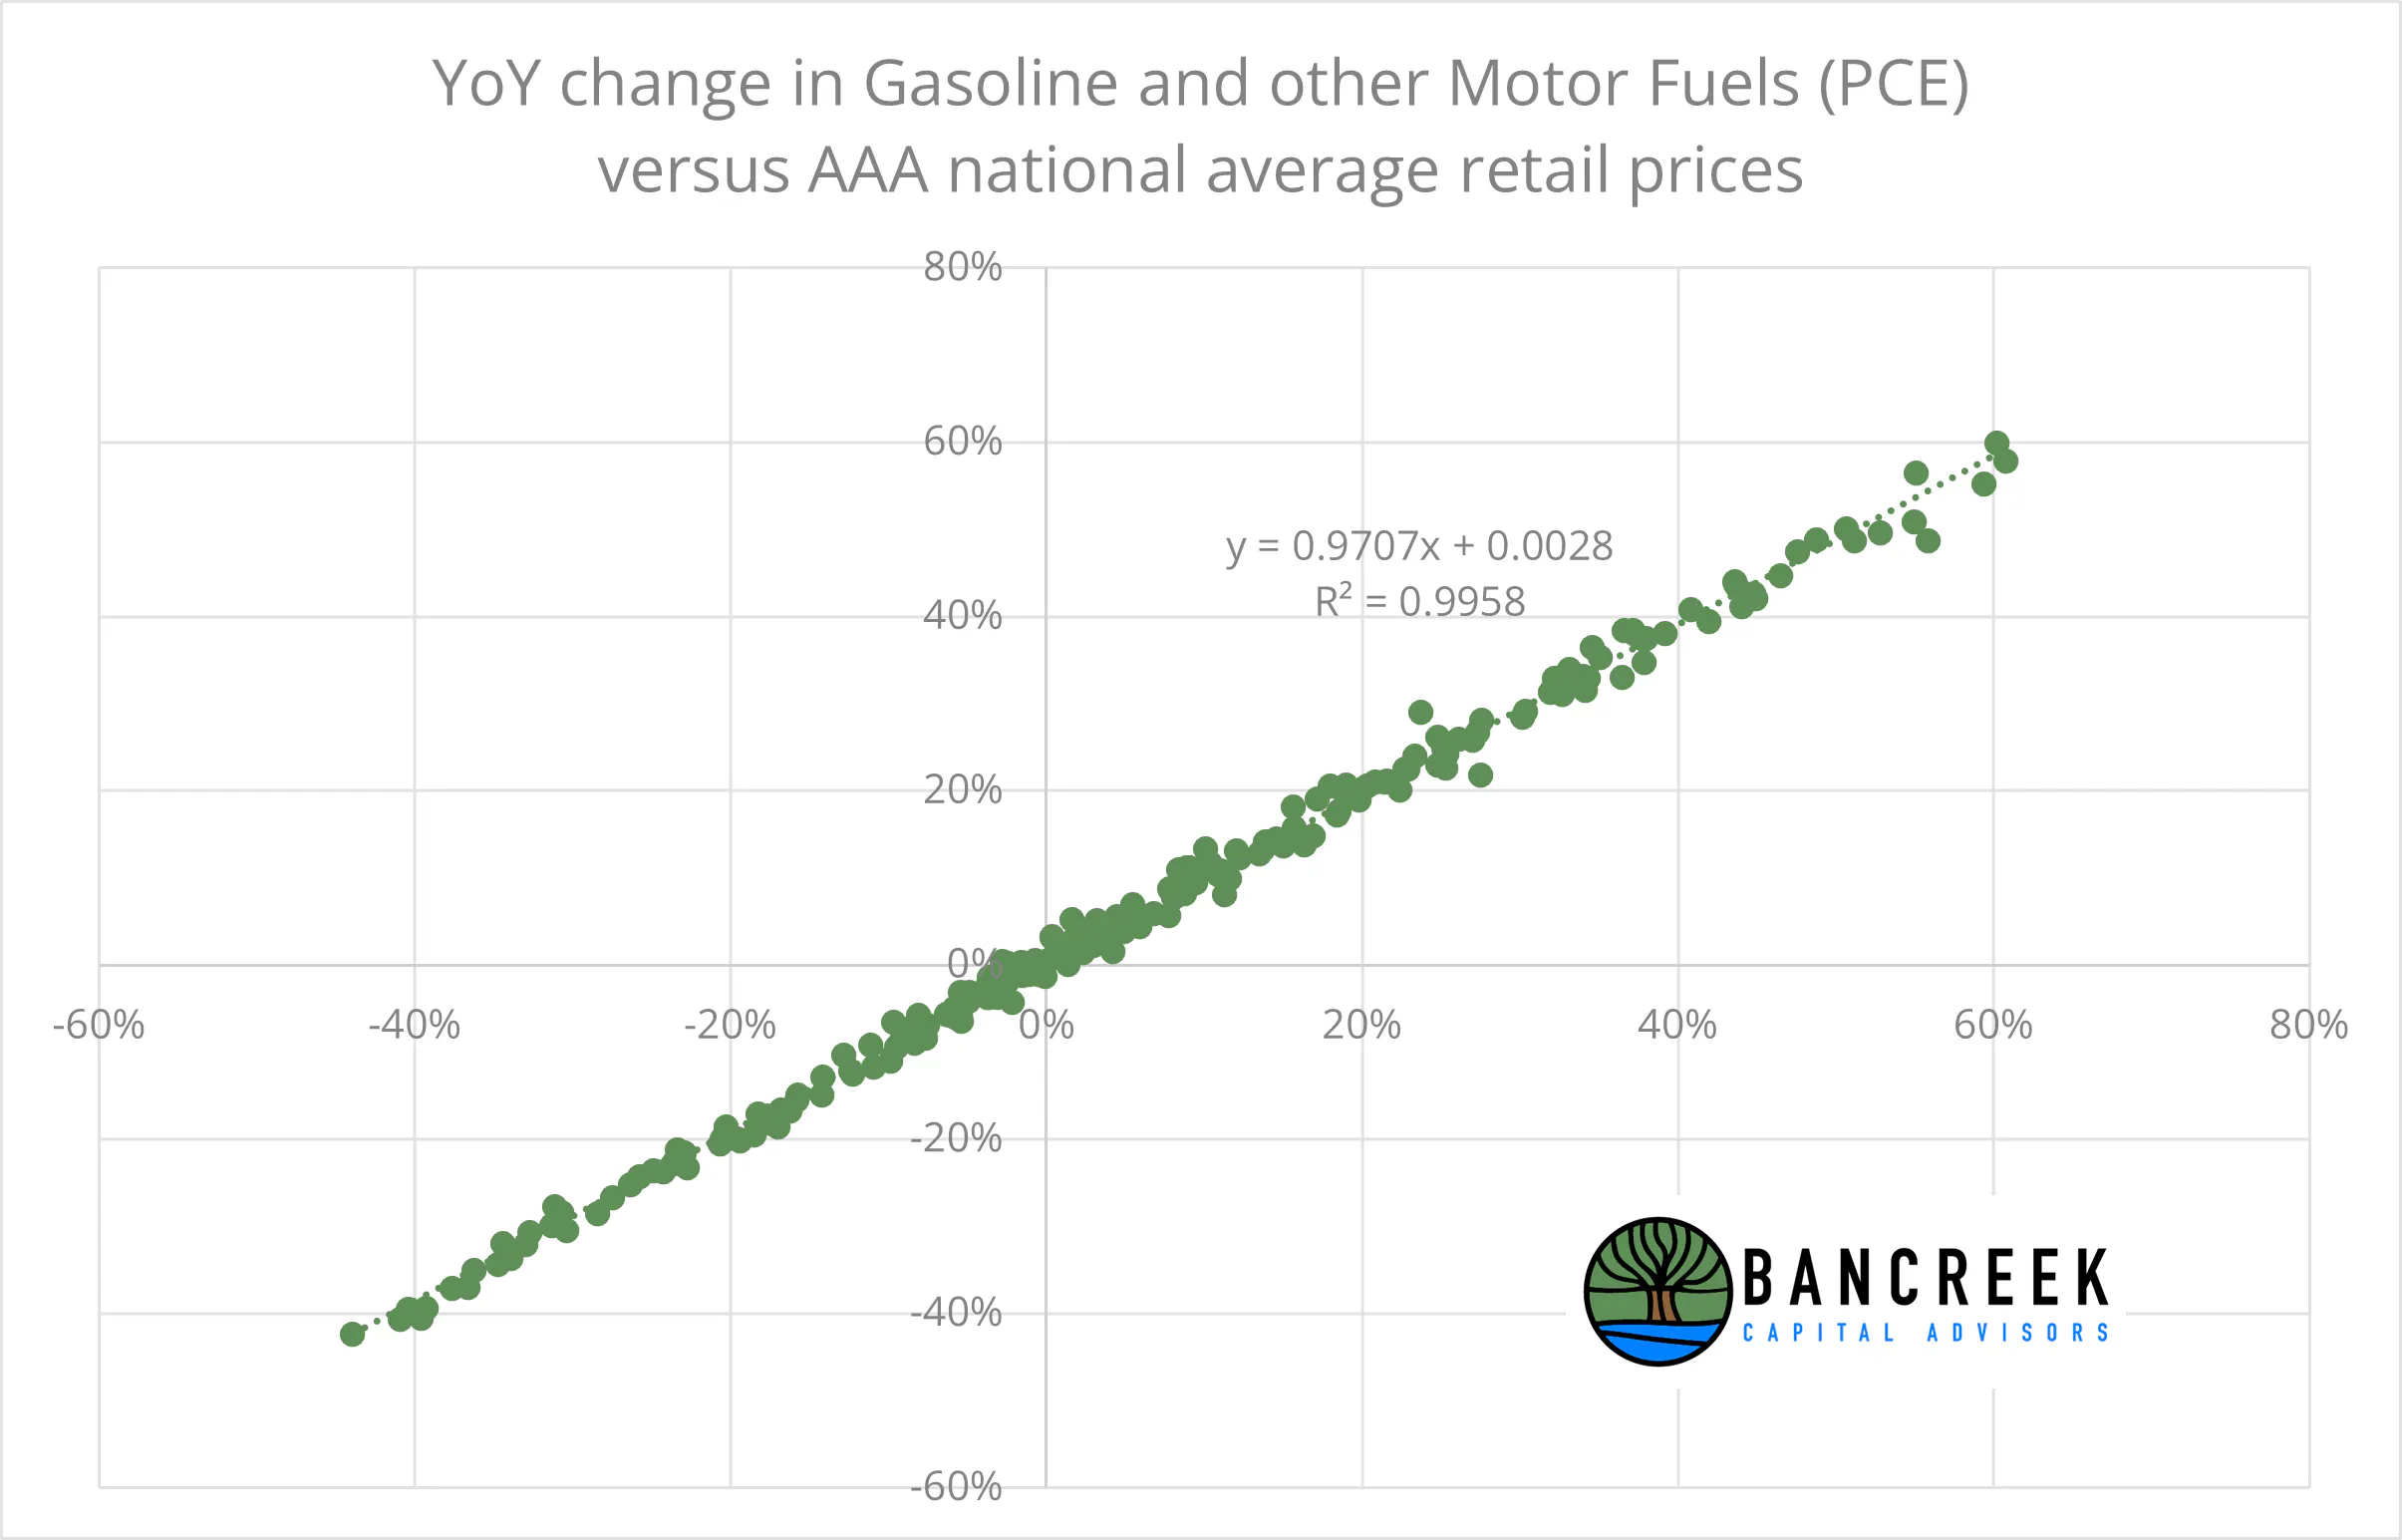
While this month's data was (let's be honest) once again a snoozer, we expect things to get more interesting next month. As we wrote about at the start of the week, gasoline prices (as measured by AAA) are down over 10% YoY in August 2024. This will not only impact CPI when its released on 9/11, but PCE as well thanks to (as shown below) a very strong correlation between PCE's Gasoline and other motor fuels item and AAA average retail prices.
Source: BEA, Bloomberg, Bancreek Capital Advisors, LLC
For modeling purposes, let's assume this correlation holds next month. Gasoline and other motor fuels would experience 10.7% YoY deflation. If we multiply this by the item's weight (2.45%) we get an expected inflation impact of -26 basis points. In July 2024, the inflation impact of this item was negligible, coming in at just +1 basis point. Subtract this from our August 2024 estimate and it seems reasonable to expect 27 basis points of additional deflation in August 2024 beyond what we saw in July 2024. That would put overall YoY PCE at just 2.23%.
Now that we have all of the AAA gasoline prices, this math is the easy part. The hard part is what the market would do with this information, if it should present itself as we expect. Will it celebrate inflation closing in on 2%? Will it ignore this data since gasoline is "non-core"? Or will it interpret this as too fast of a move and see the goldilocks scenario at risk?
Labor data is in the driver's seat
We believe the answer to those questions depends not on the inflation data, but on the jobs data that is due out a week from today. If this data shows a resilient market, lower inflation may be welcomed by the market. If it shows very weak labor market, a meaningful decline in inflation could reinforce the view (that you may recall spread like wildfire with the last jobs print in early August) that the Fed may have acted too late.
One thing is certain though, and that's that we'll be all over next Friday's data release! We'll not only update our establishment data nonfarm payrolls treemap, but also study the household survey data to provide a better understanding on the movements in the components that underlie the unemployment rate. Make sure to subscribe to our newsletter to stay in the know on all our latest work!
Enjoying this post?
Tell others about it.

Bancreek's Actively Managed ETFs
If you are interested in learning more about Bancreek Capital Advisors' actively managed ETFs click the link below
Learn MoreMore articles like this
Fetching Related Posts
There are no other articles tagged with Research
