Going up? Broad-based upward pressure on June 2025 CPI

Eric Pachman
Published
July 15th 2025
Eric Pachman
Published
July 15th 2025
June 2025 year-over-year inflation (CPI) steps up to 2.67%
This morning the Bureau of Labor Statistics released the June 2025 US CPI report for All Urban Consumers (CPI-U). Overall CPI-U was reported at 2.67% year-over-year (YoY) for June, up 32 basis points from 2.35% YoY last month.
As a reminder, Bancreek publishes two visualizations that can help you explore CPI-U in granular detail. Both of these visualizations have now been updated through June and are embedded below:
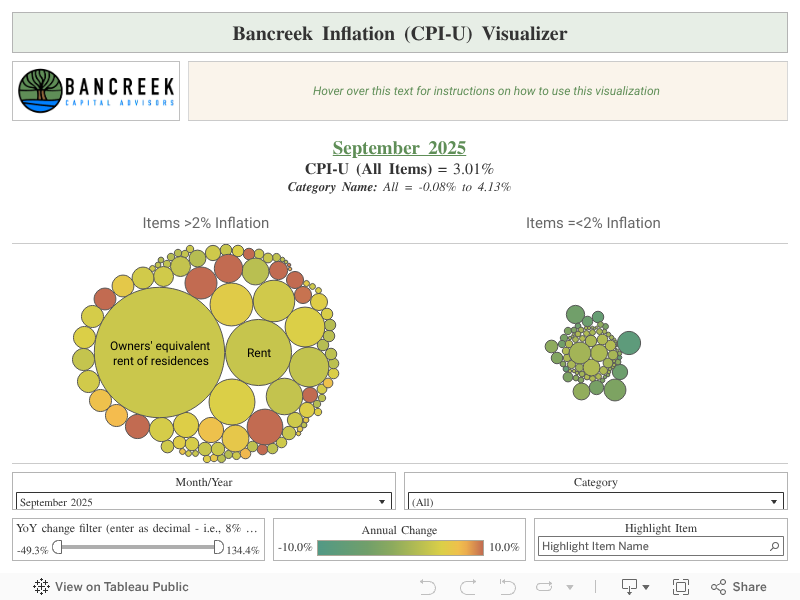
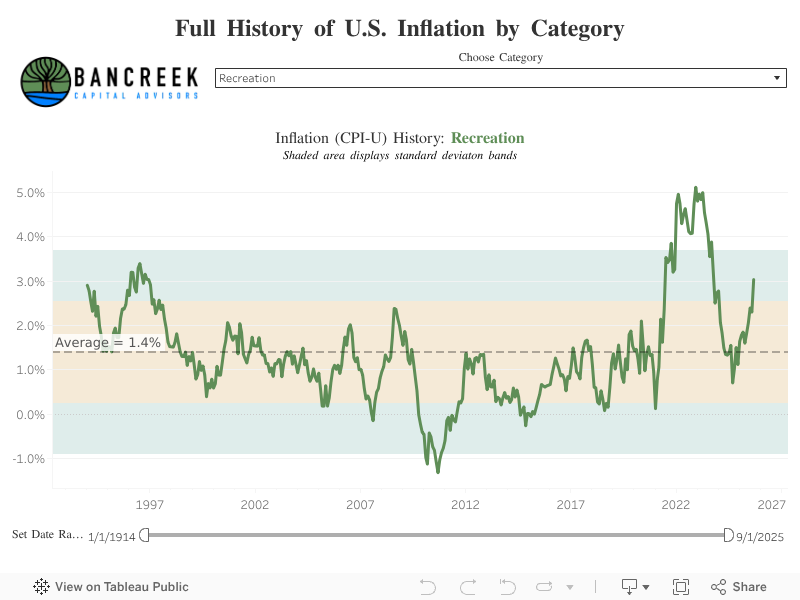
This post hopefully will further assist in your analysis of the moving parts underlying this month’s CPI report. Its goal is not to provide a comprehensive analysis of the nearly 180 items we track (that’s what the visualizations are for), but rather just to point to the most meaningful changes from one month to the next.
To perform this analysis, we track a measure we call “inflation impact,” which we calculate by multiplying each item’s YoY inflation by its weight in the prior year period. You can think of this as “weighted inflation” as opposed to the “unweighted inflation” that is more commonly reported by the media. Each month we take the weighted inflation of each item we track in CPI-U and then sum them up to overall CPI-U. Then we compare these weighted inflation numbers from one month to the next to see what drove the sequential increase or decrease. In this way, we can precisely identify the most significant drivers in the change in YoY CPI-U from one CPI report to the next.
Broad-based upward pressure on CPI in June
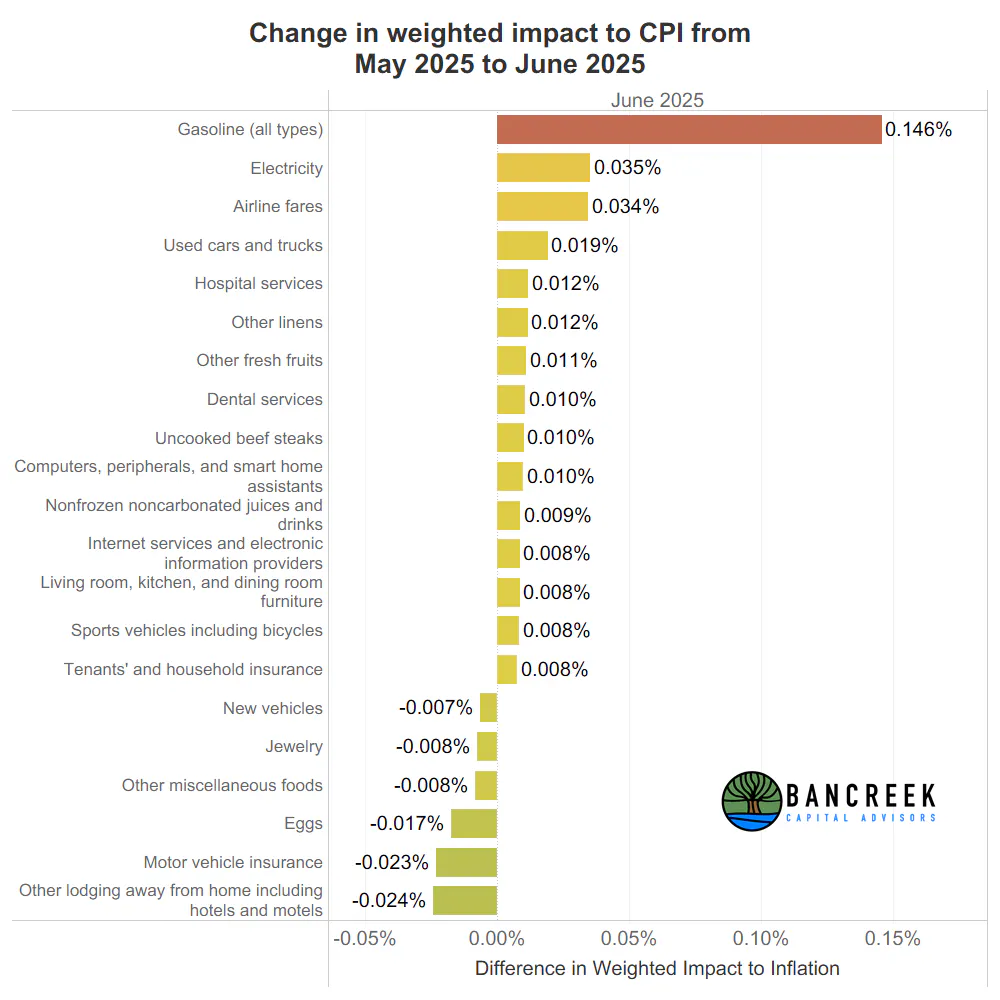
The following chart shows our "walk across" in weighted inflation from last month's 2.35% YoY print to this month's 2.67% print. Note in this chart, we only show items that experienced a change in YoY weighted inflation +/- 0.7 basis points. If you diligently add up the impact of the items in the chart you'll see they sum to 25 basis points. So, they don't quite explain the entire 32 basis point increase, but they get most of the way there.
Source: Bancreek Capital Advisors, LLC analysis of data from bls.gov
Despite this chart not capturing the entire inflation picture, it still clearly shows that there are many more items incrementally adding to inflation than those detracting from it. And the items don't really have a theme tying them together. There's energy, beef, fruit, used cars, hospital services, airline fares, dental services, computers, and nonfrozen noncarbonated juices and drinks. Meanwhile, we got some help from eggs, auto insurance, and hotels.
Detractors from June inflation were largely lower quality
So what hints does today's CPI print give us on where inflation is headed in the future?
To answer this question let's first start with the items that helped us this month.
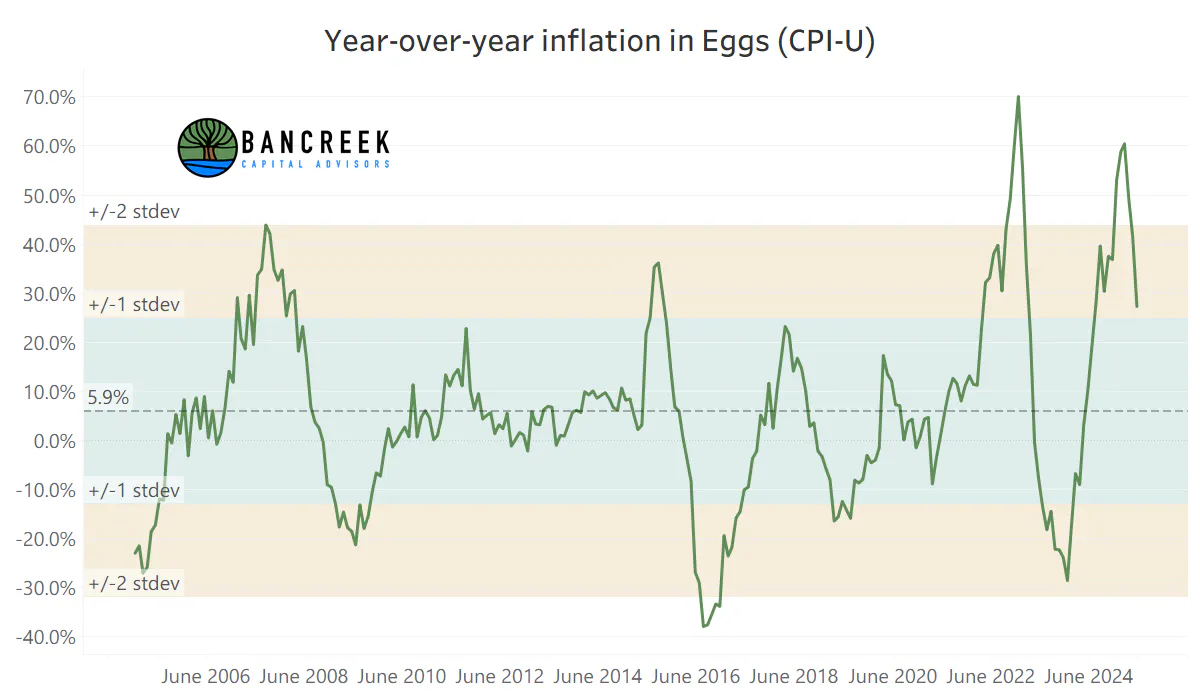
First, there's eggs. While the steep decline in eggs is nice to see, egg price disinflation can only help CPI so much given its relatively insignificant 0.12% weight. So, you will likely hear a lot about how egg price inflation was 27% this month, down from 42% last month. But when you weight these numbers, the actual inflation impact was just 3.3 basis points, down from five basis points last month. This means that if we magically wiped out all egg inflation next month, overall CPI would go from 2.67% to 2.64%. It's just not that big of an impact. Also, when you look at the following chart note the standard deviation of historical egg inflation. It's enormous! Basically, 27% egg price inflation is not too far above the +1 standard deviation line... meaning it's nearly back to what you would consider "normal" volatility.
Source: Bancreek Capital Advisors, LLC analysis of data from bls.gov
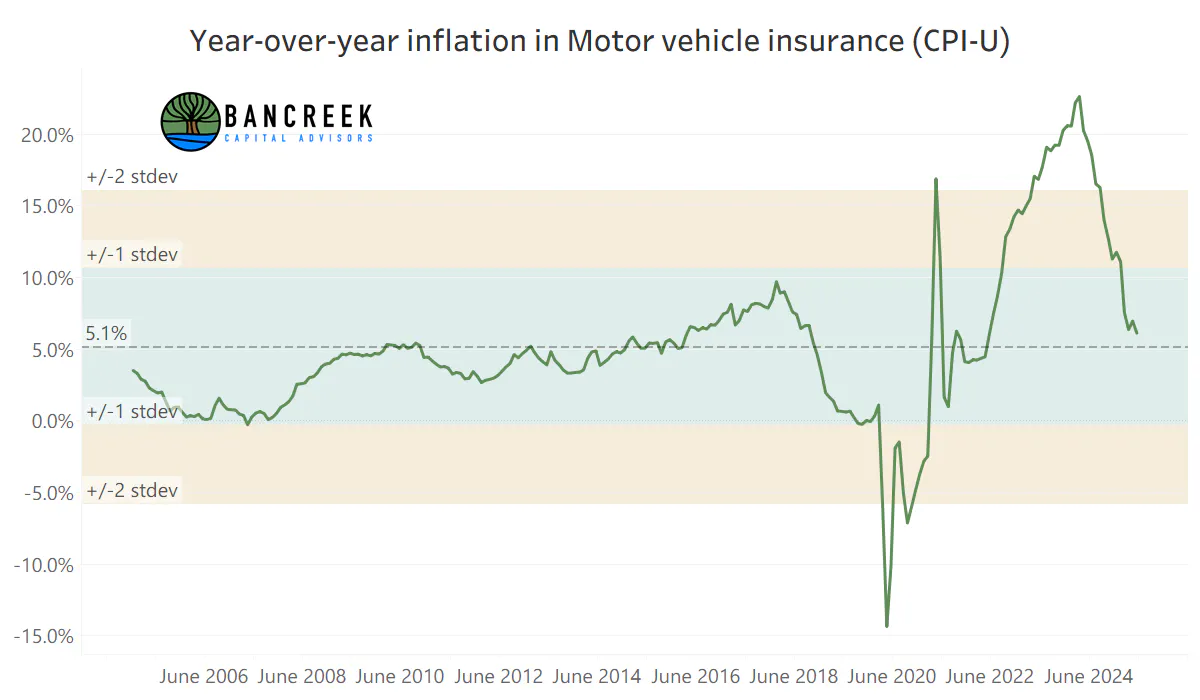
Next, we'll turn to Motor vehicle insurance. After a wild (and far longer than anyone expected) run up in inflation on this item, it has finally come all the way back down to 6.1%, just 60 basis points above this item's 5.5% historical average. In other words, the low hanging fruit has largely been harvested from this one item as far as inflation benefits go. To provide some context, just one year ago, Motor vehicle insurance carried an inflation impact of 52 basis points! To hammer this home, this means that out of the 2.97 points of inflation a year ago, 0.52 points was Motor vehicle insurance. Now, Motor vehicle insurance's inflation impact is just 18 basis points. In other words, 0.3 points have been shaved off CPI just from the easing of this one item back down to its historical average inflation. Last year we pointed to the potential inflation benefits that could get unlocked from this item. That's largely played out now, so unless this item overcorrects and turns deflationary, we probably shouldn't be looking to it to put much more downward pressure on CPI.
Source: Bancreek Capital Advisors, LLC analysis of data from bls.gov
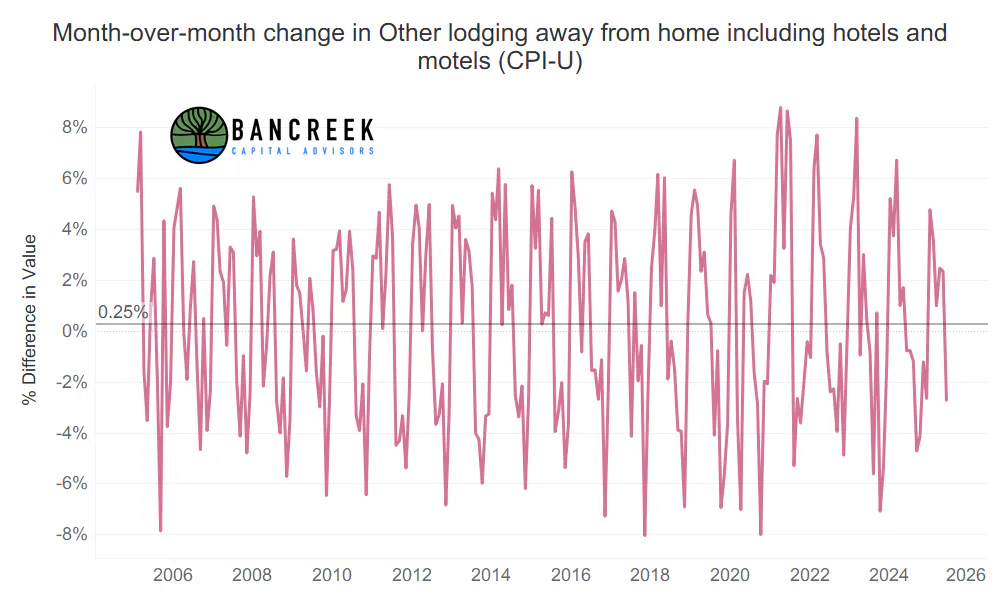
Moving onto "hotels" (i.e., Other lodging away from home including hotels and motels). Before getting excited about the sequential step down in this item's index value, maybe consider the following chart, which shows how manic this item has been over time. It just is in the nature of this item to swing back and forth wildly. As such, it's probably wise to read too much into June's weakness in hotel inflation. Odds are it's just going to flip back in a month or two.
Source: Bancreek Capital Advisors, LLC analysis of data from bls.gov
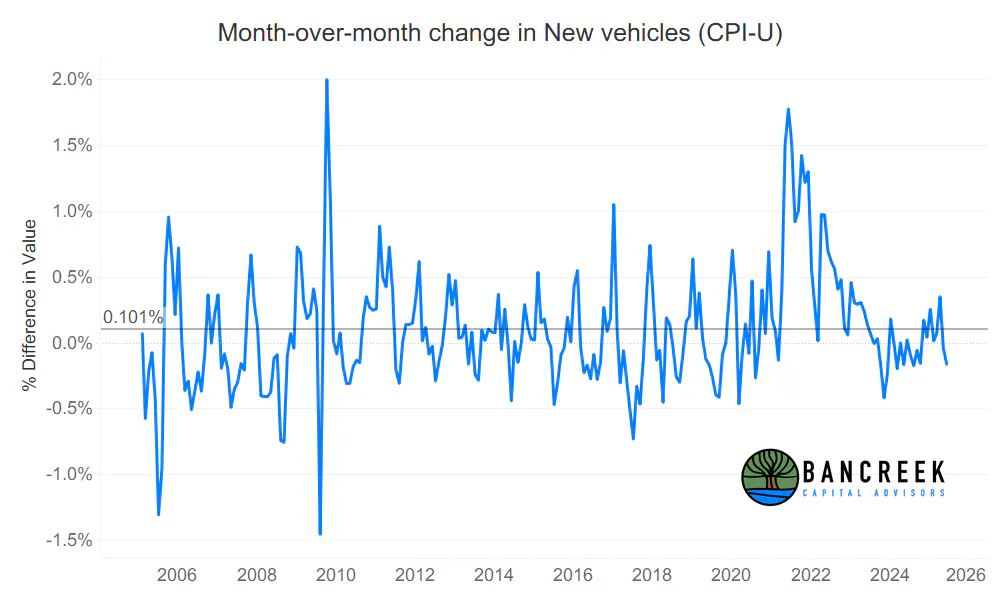
Rounding out the "good guys" this month, we'll quickly touch on New vehicles. As shown below, this item's chart looks far more constructive than, say, the hotels chart. So, New vehicles could potentially be one of the higher quality good guys in this month's data release.
Source: Bancreek Capital Advisors, LLC analysis of data from bls.gov
Exploring the items that added to June's inflation
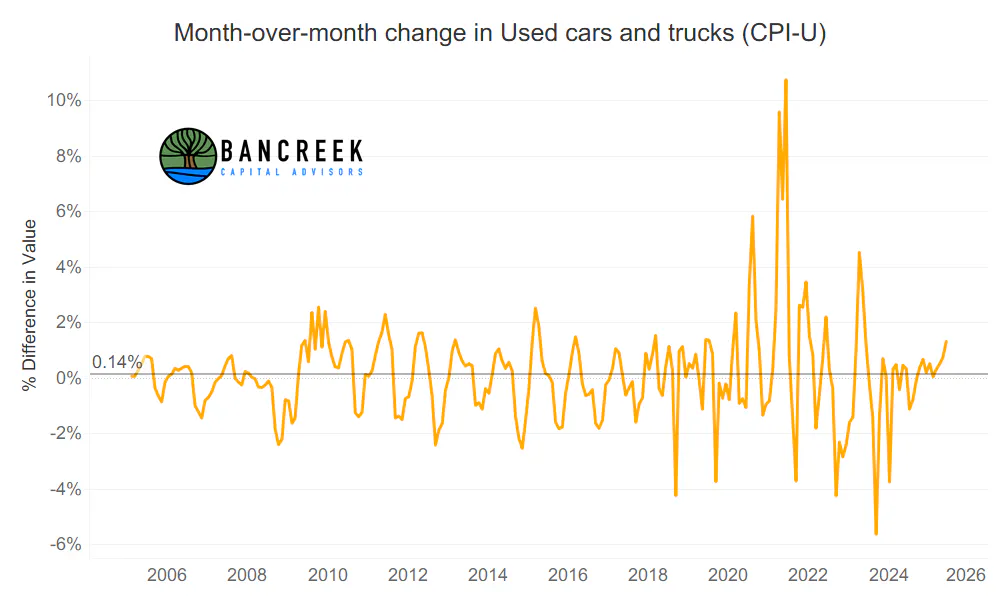
However, any excitement around the sequential decline in New vehicles quickly evaporates when looking at the sequential Used autos and trucks series, which popped in June to 1.3%. As shown below, this is the highest level of sequential inflation experienced by this item in two years.
Source: Bancreek Capital Advisors, LLC analysis of data from bls.gov
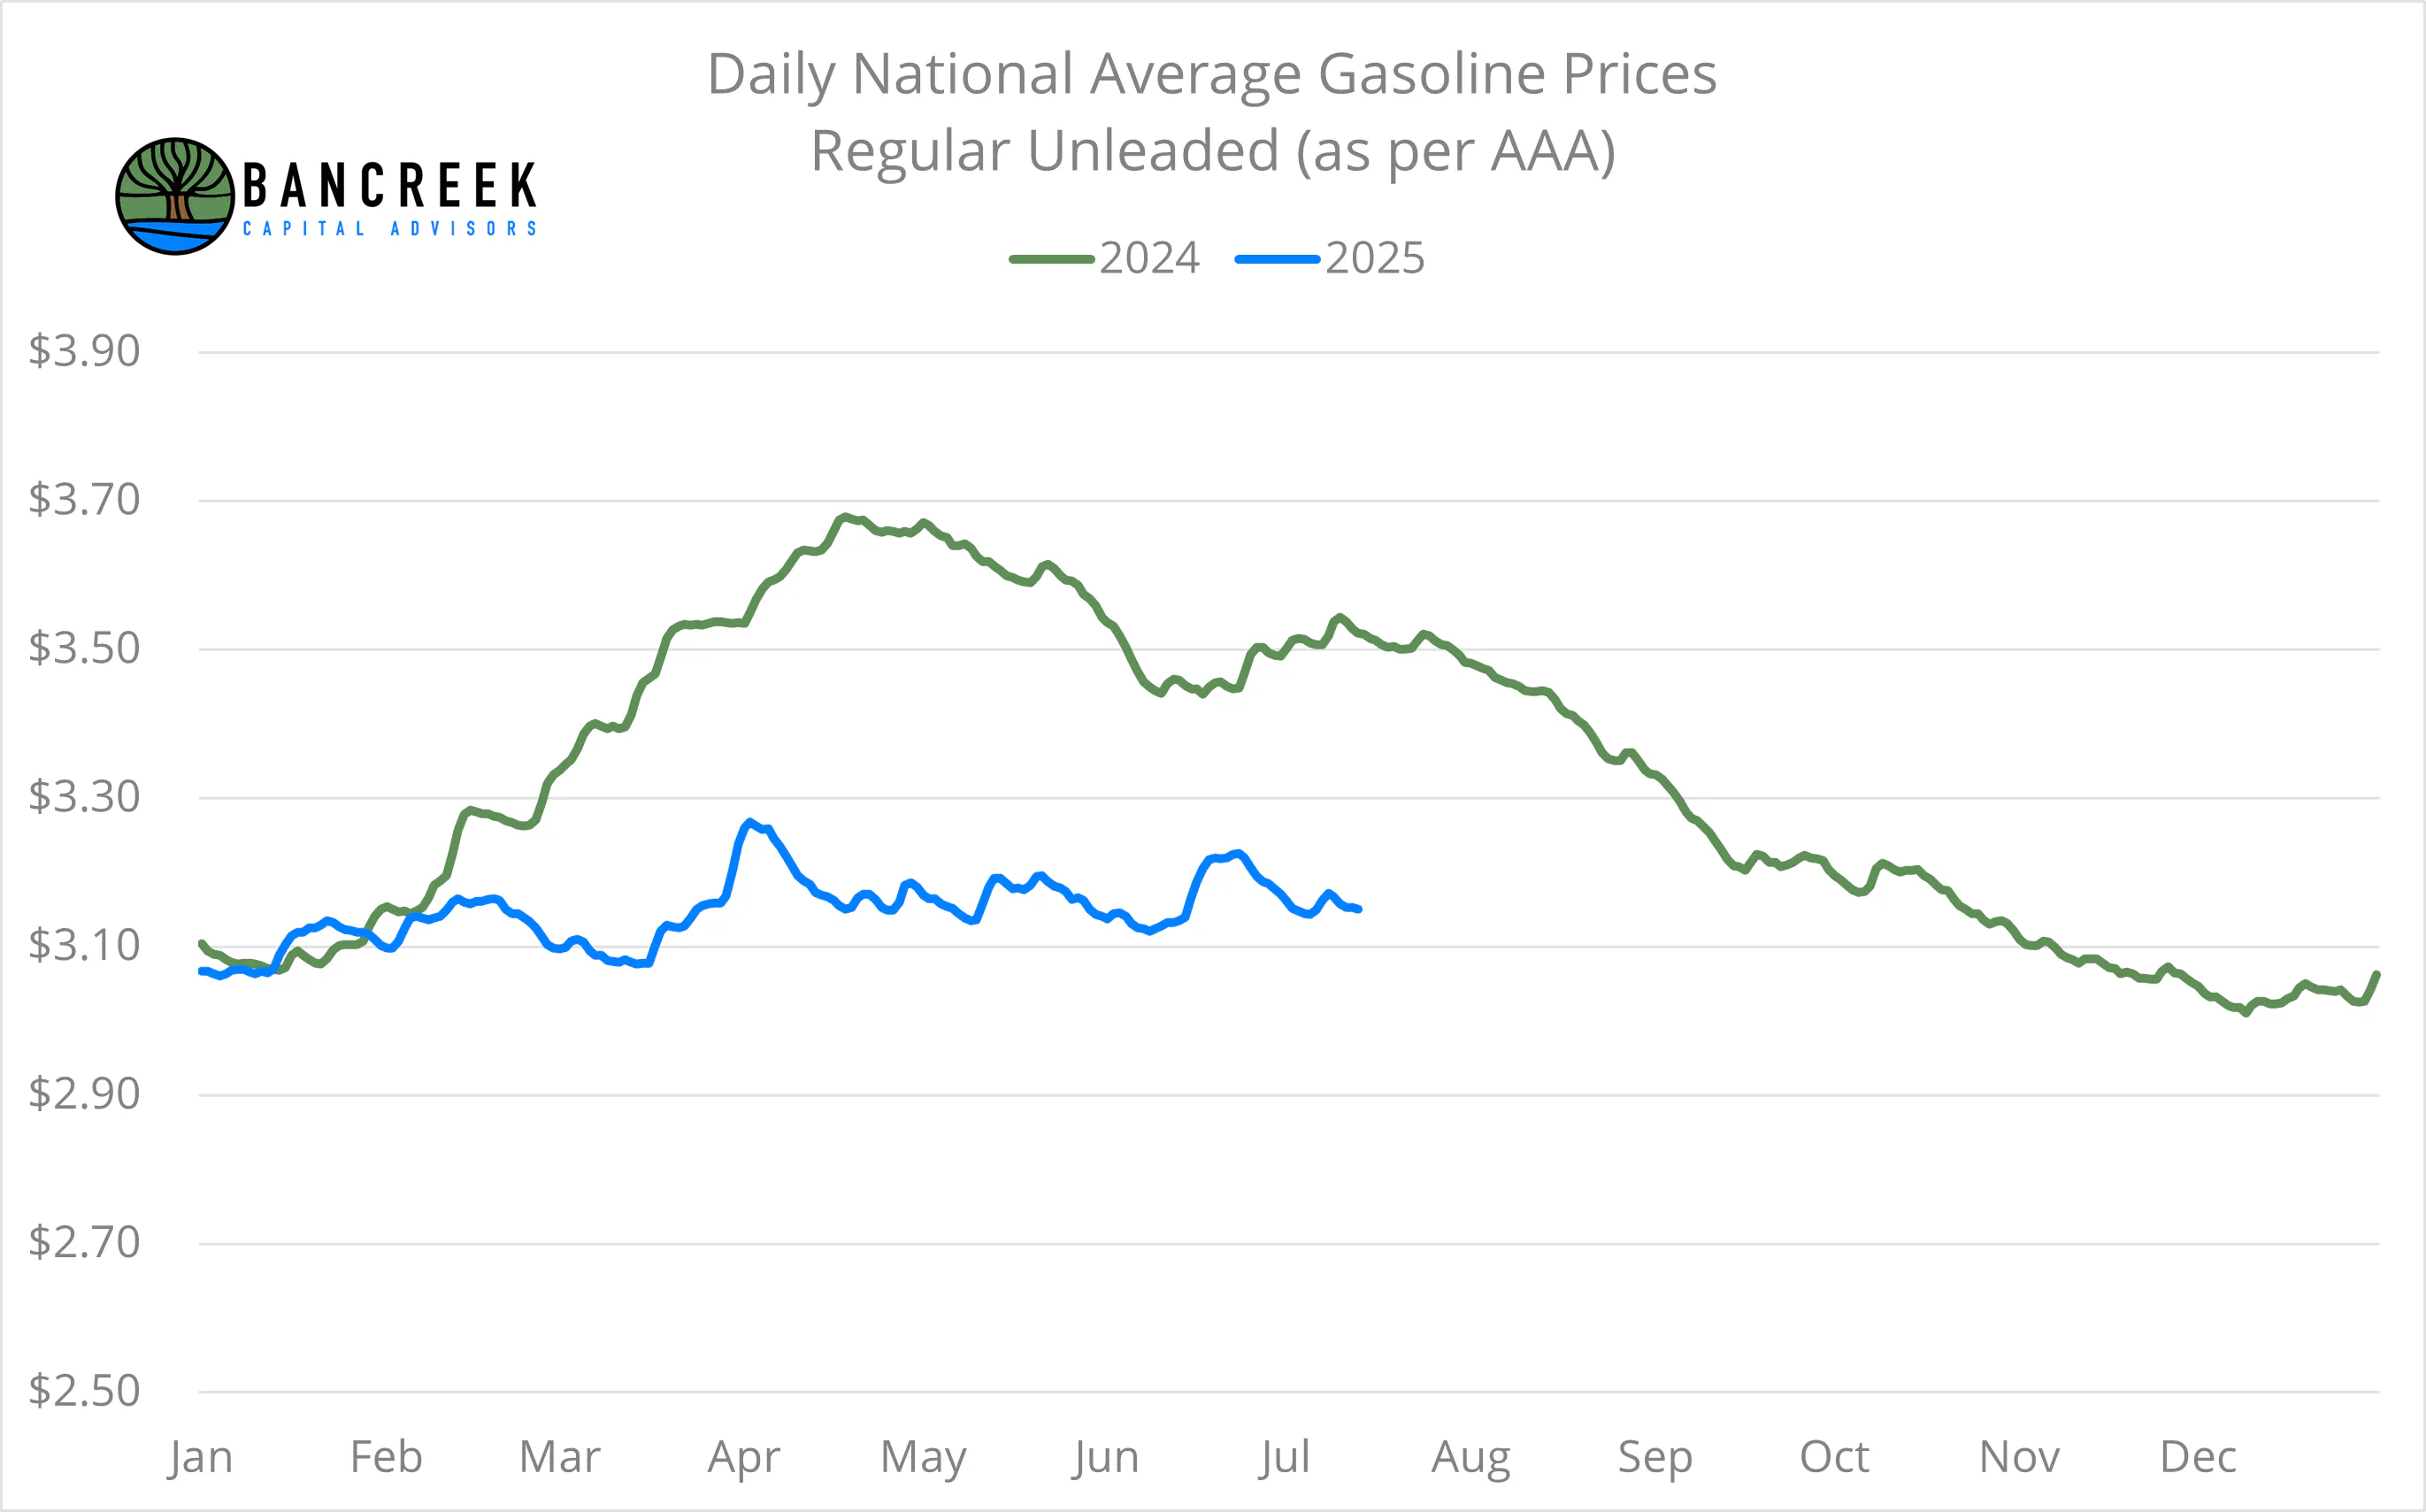
Next, let's turn to gasoline. As shown in the below chart, gasoline should continue to print meaningful deflation for at least the next couple months. Drilling into July, in 2024 average retail gasoline prices were $3.51 per gallon for the month. Through the first half of this July, the same measure has averaged just $3.16 per gallon. If this average holds, we should expect July gasoline price deflation to come in around -10%, which would be up from June's -8.3%. The problem here is that the comps on gasoline get much harder as we move into fall. For example, average retail gasoline prices in October 2024 were $3.17 per gallon, which further fell to $3.08 per gallon in November. So, unless gasoline prices start to fall into the high $2 per gallon range, we should expect gasoline's deflationary benefit to disappear by late fall. Note that if this happens, it will add 0.30 points to headline inflation, which without any other offsets, should put a 3-handle on CPI.
Source: Bloomberg
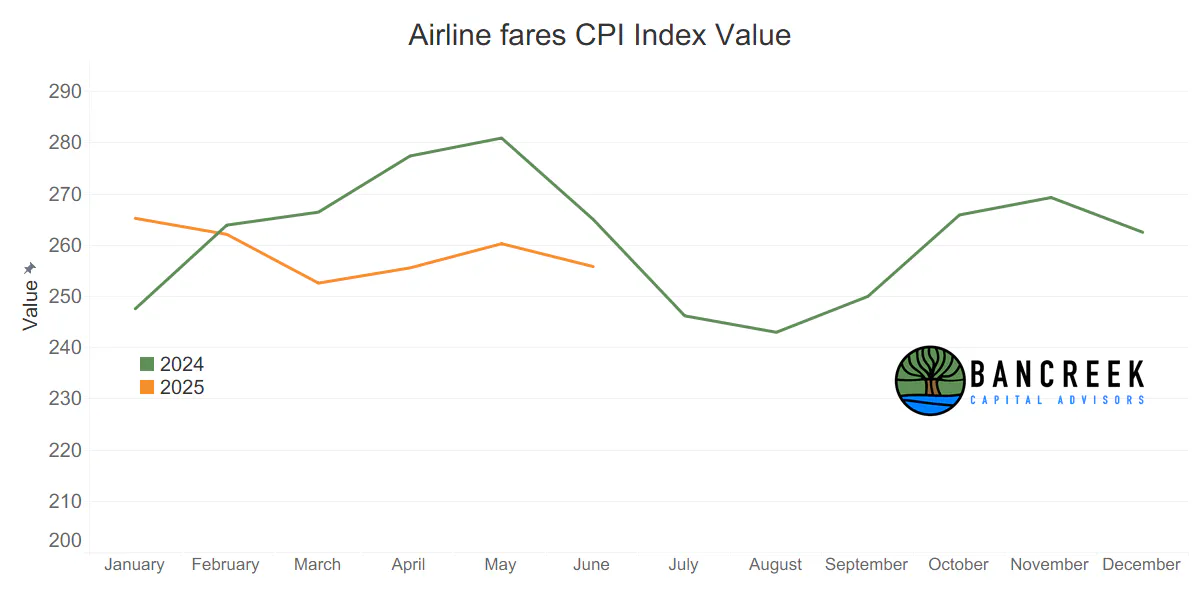
Moving on to Airline fares, which is a similar story to gasoline in that it's facing tougher comps as we move forward. As shown below, 2024 comps for Airline fares get quite tough the next three months. As such, unless we get a large sequential decline from June's index value, we are likely looking at upward pressure to YoY inflation from this line item as well.
Source: Bancreek Capital Advisors, LLC analysis of data from bls.gov
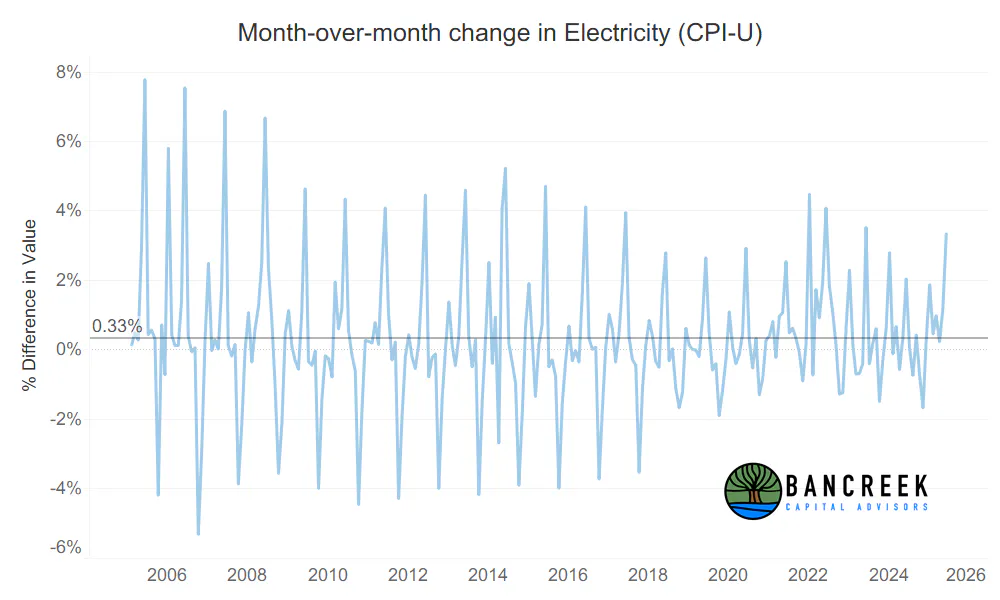
Next up is Electricity, which this month notched its highest sequential inflation in two years (3.3%). This chart is quite fascinating. Note the peaks and troughs going back through the data. Unsurprisingly, at least until COVID, the peaks always occurred in June and troughs always hit in October. Makes sense, right? But post-COVID this very predictable pattern started to break down, which as shown below, is especially notable in that the troughs are no longer nearly as deflationary as they used to be. Also, we started seeing "June-like" spikes in January electricity inflation as well, which besides 2006 hadn't occurred in the pre-COVID history of the data.
Long story short, this month's surge in Electricity inflation is not at all abnormal for June. But, all bets are off where this item goes from here since it's predictably historical seasonality appears to have broken down over the past few years.
Source: Bancreek Capital Advisors, LLC analysis of data from bls.gov
Where's the beef?
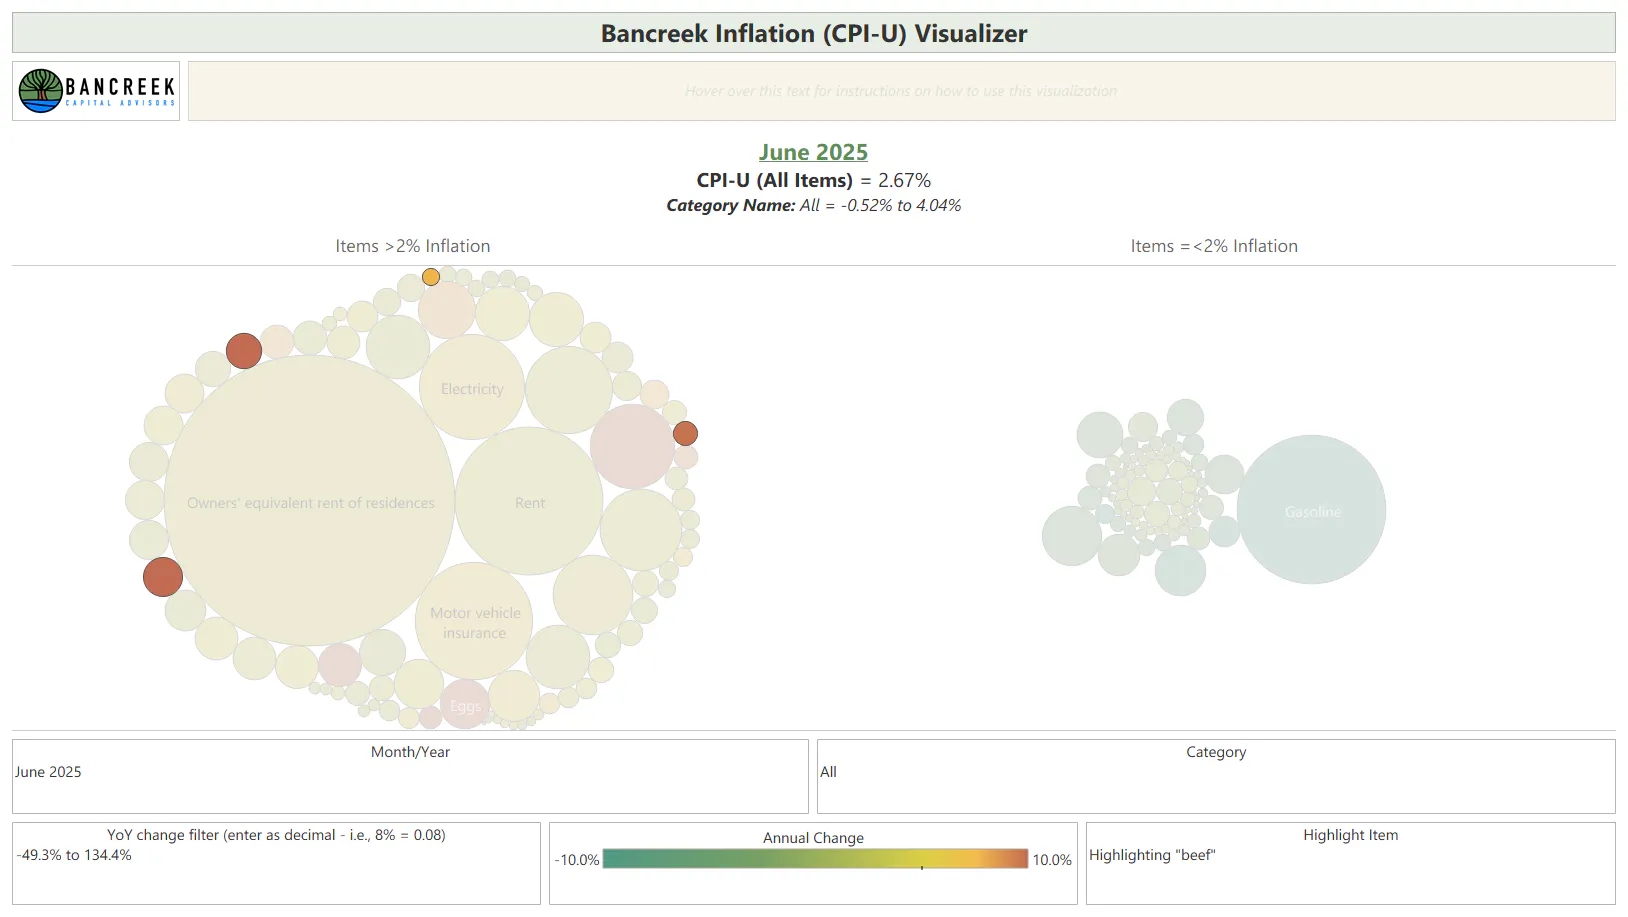
That covers most of the larger items that put upward pressure on inflation this month. But as we detailed in the first chart in this post, there were several other smaller items that together added up to a meaningful uplift to CPI. One of the top ones that stood out to us was the various types of beef tracked by the BLS, all which are rising considerably right now.
To find these items, we went into our CPI data visualization and just typed "beef" in the "Highlight item" keyword search box at the bottom right of the visualization. Tableau then highlights all of the items containing the keyword beef, which we can then hover over to see that in June 2025:
- Uncooked beef steaks was up 12.4% YoY
- Uncooked ground beef was up 10.3% YoY
- Uncooked beef roasts was up 9.8% YoY
- Uncooked other beef and veal was up 7.7% YoY
To be fair, these items all have very small weights. But together, these four items added five basis points of inflation to CPI in June. That's not immaterial. Without inflation on beef products, CPI would have rounded to 2.6% rather than 2.7%.
Source: Bancreek Capital Advisors, LLC analysis of data from bls.gov
Don't forget, CPI is still all about shelter
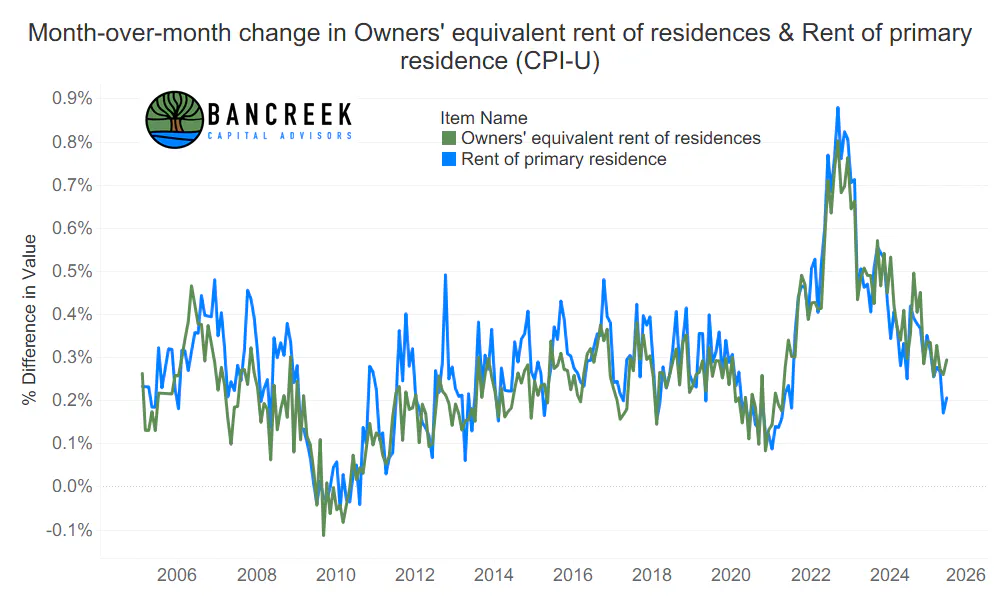
Let's be honest. While this discussion has been fun, CPI is still just "shelter plus some other stuff," thanks to shelter's absolutely dominant weight within the inflation measure. We may get lulled into a sense of complacency when items like OER and Rents are behaving, but if these items ever start misbehaving again we'll soon completely forget about searching for minute tariff impacts to CPI as they will be completely dwarfed by any resurgence in housing inflation. As the chart below shows, this is not a concern for today. But it's something to always be aware of when thinking about CPI going forward. The biggest tail risk that no one is talking about is what happens if housing prices accelerate again, lifting OER (which alone carries a 27% weight in CPI), which would then almost certainly pull up inflation well beyond a level that can sustain rate cuts. Based on Case Schiller home price indices, this isn't happening quite yet. But the environment seems primed for housing speculation again, in our view, especially if the Fed starts cutting rates soon.
Source: Bancreek Capital Advisors, LLC analysis of data from bls.gov
Tariff impact? Uncertain.
We'll close by mentioning that so far, we've neglected to mention anything on tariffs. That's because outside of some food items like beef and coffee (which most folks inexplicably have decided don't matter anyway since they are "non-core") we just don't see a lot of evidence that definitively points to tariff driven inflation. Take some time to peruse our visualization, specifically focusing on the items that are red and dark orange, and see if you agree with us. Yes, there is a spike in the almost completely insignificant Audio equipment. But outside of that, there's just not much to point to.
Of course this doesn't mean that it's not coming. But as we reported last month, even if it does, collectively all goods that one would expect to rise with tariffs are far smaller than just OER alone. That's why we recommend paying more attention to the housing market than to tariffs to get a sense of where CPI could be headed. Shelter may not be what the media cares about right now, but it's what the math cares about. And as long as we are around publishing our thoughts, we'll always be on Team Math. Let's discuss on socials! You can find us on LinkedIn and X.
Enjoying this post?
Tell others about it.

Bancreek's Actively Managed ETFs
If you are interested in learning more about Bancreek Capital Advisors' actively managed ETFs click the link below
Learn MoreMore articles like this
Fetching Related Posts
There are no other articles tagged with Research
