Nonfarm Payroll: A Strong May, Concentrated in Three Industries

Eric Pachman
Published
June 5th 2026
Eric Pachman
Published
June 5th 2026
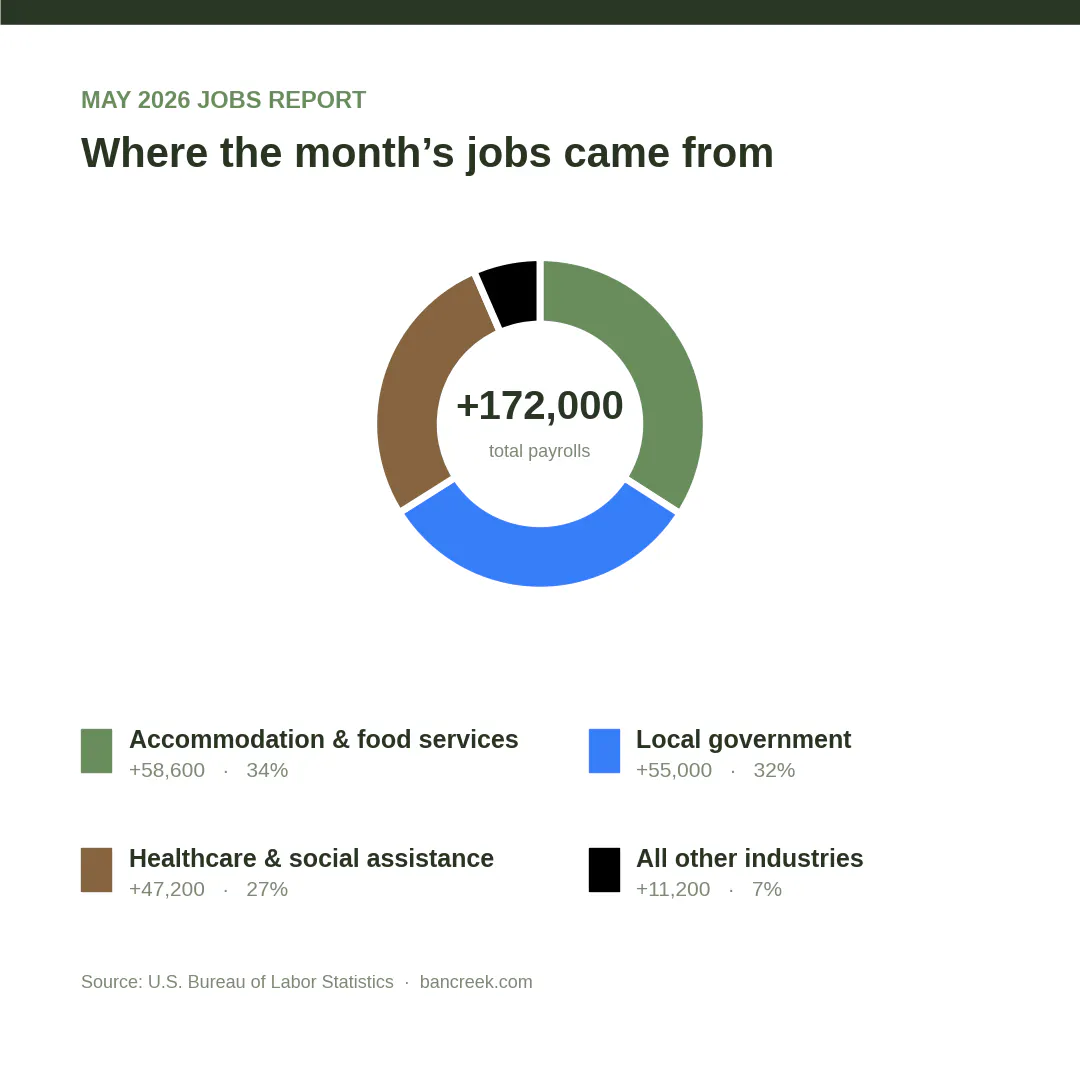
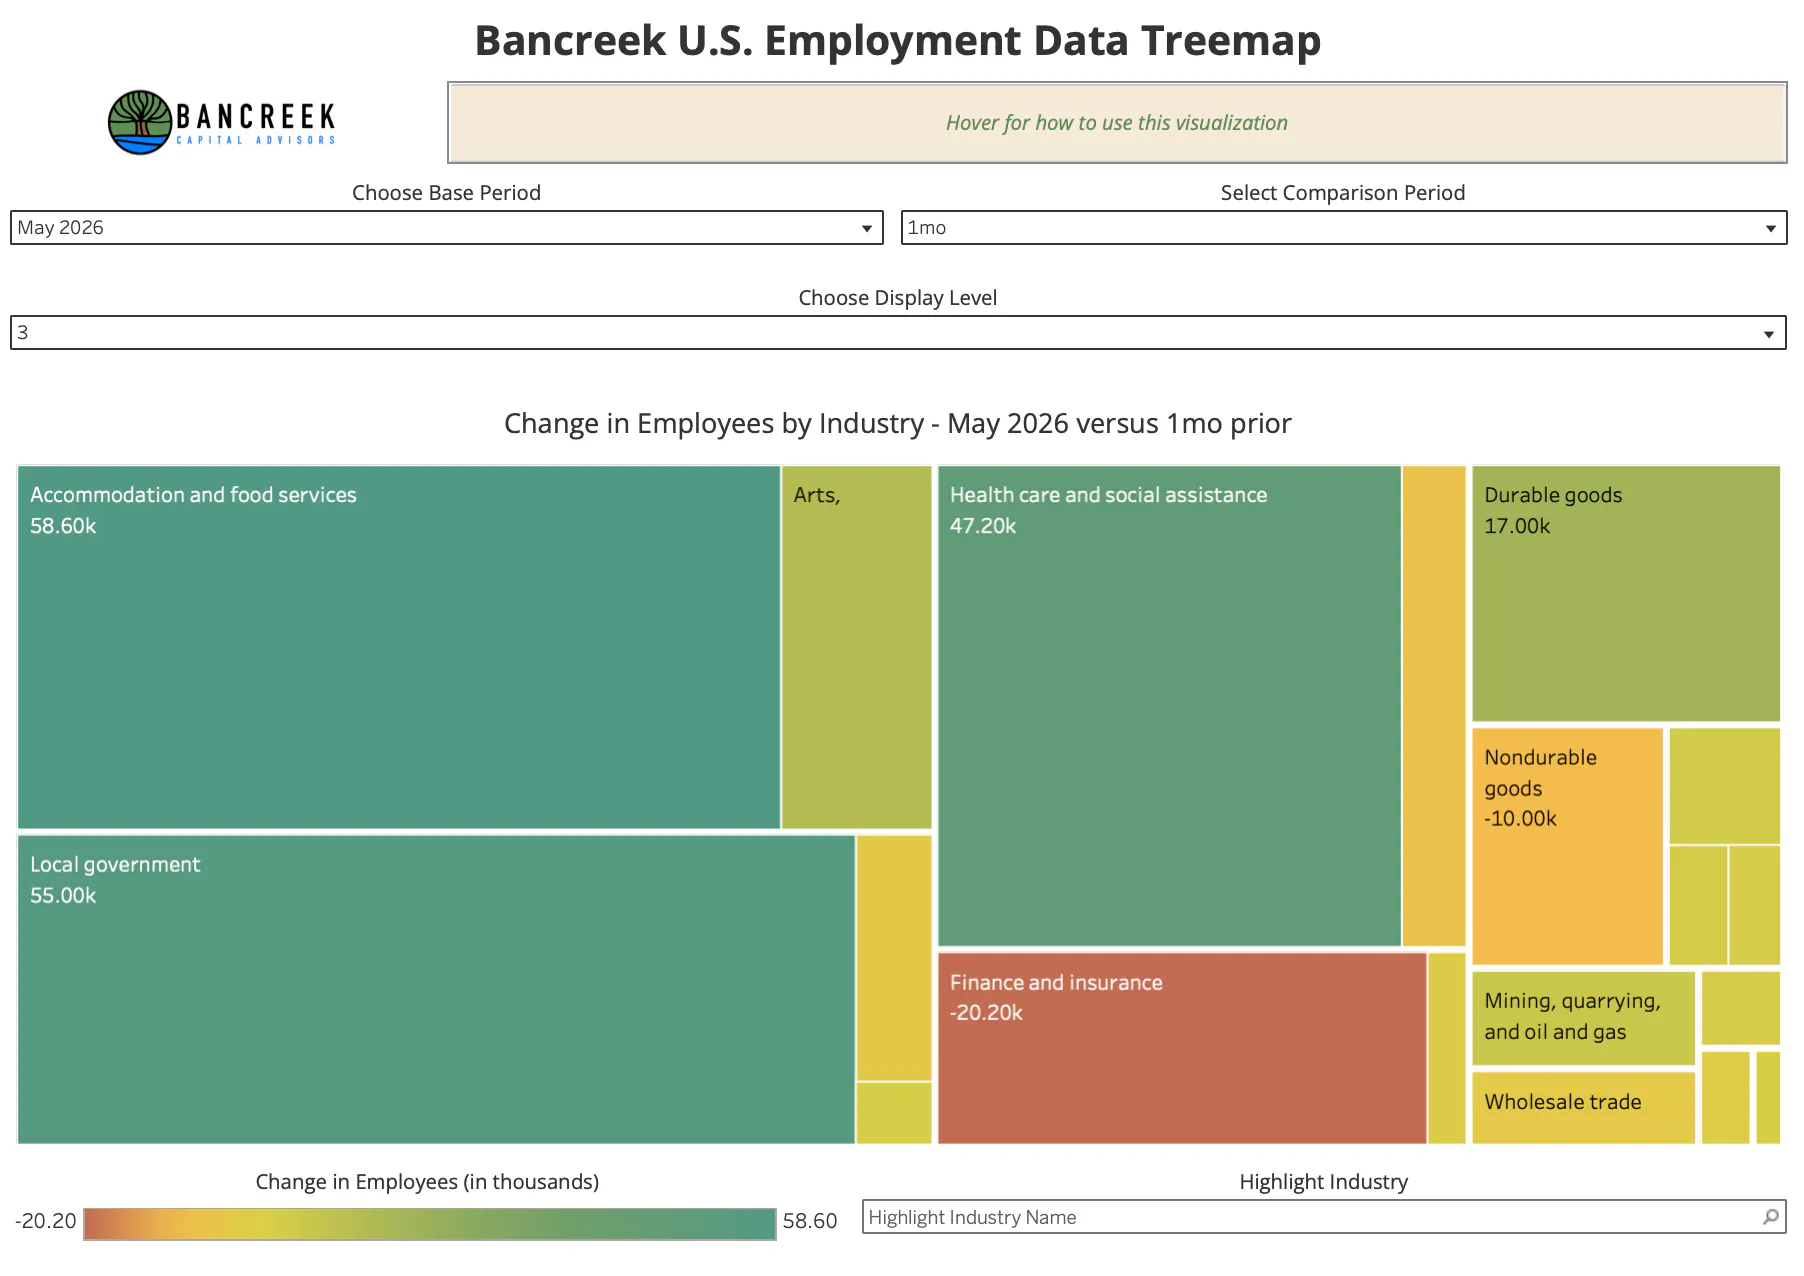
This morning, the Bureau of Labor Statistics reported that U.S. non-farm payroll (NFP) jobs increased by 172,000 in May 2026 compared to April 2026. Bancreek has updated its interactive treemap so you can explore all the moving parts of today's release - and, more importantly, put them in context against historical data going all the way back to 1990.

Key takeaways from the May 2026 NFP release
First, we strongly recommend holding this release - and every NFP release - lightly. The BLS gives you a single-point "estimate" each month, but it's loaded with sample error. Open the PDF of today's release, scroll to page 9, and you'll find a section called "Reliability of Estimates." There, the BLS tells you the 90-percent confidence interval on the monthly change is 122,000 jobs. In plain English: if the BLS ran this survey 100 times, 90 of those runs would land somewhere between +50,000 and +294,000 jobs. Mathematically, that range is what we actually learned today. The clean +172,000 makes for a headline people understand, but it implies a precision that doesn't exist. The truth is the wide range nobody pays attention to - except you.
That said, +172,000 is a strong number. Note that even at the bottom of the interval, the economy still added payrolls. That's meaningful information.
Which brings us to the visualization - where we think these jobs came from. We don't know for sure, given the sample error. But no one else knows either, and perception is reality. So let's see what perception has to say.
Three industries drove today's month-over-month (MoM) increase, accounting for 157,800 of the 172,000 jobs added:
- Accommodation and food services (+58,600 MoM)
- Local government (+55,000 MoM)
- Healthcare and social assistance (+47,200 MoM)
Source: Bancreek Capital Advisors
Accommodation and food services
The carousel below drills into this group. Flip through the charts. Outside of accommodation itself, they're all strong. Proceed with caution on any single-point estimate, but there's real value in the trends - and these trends suggest the "experience economy" is alive and well, at least so far this year.
Local government
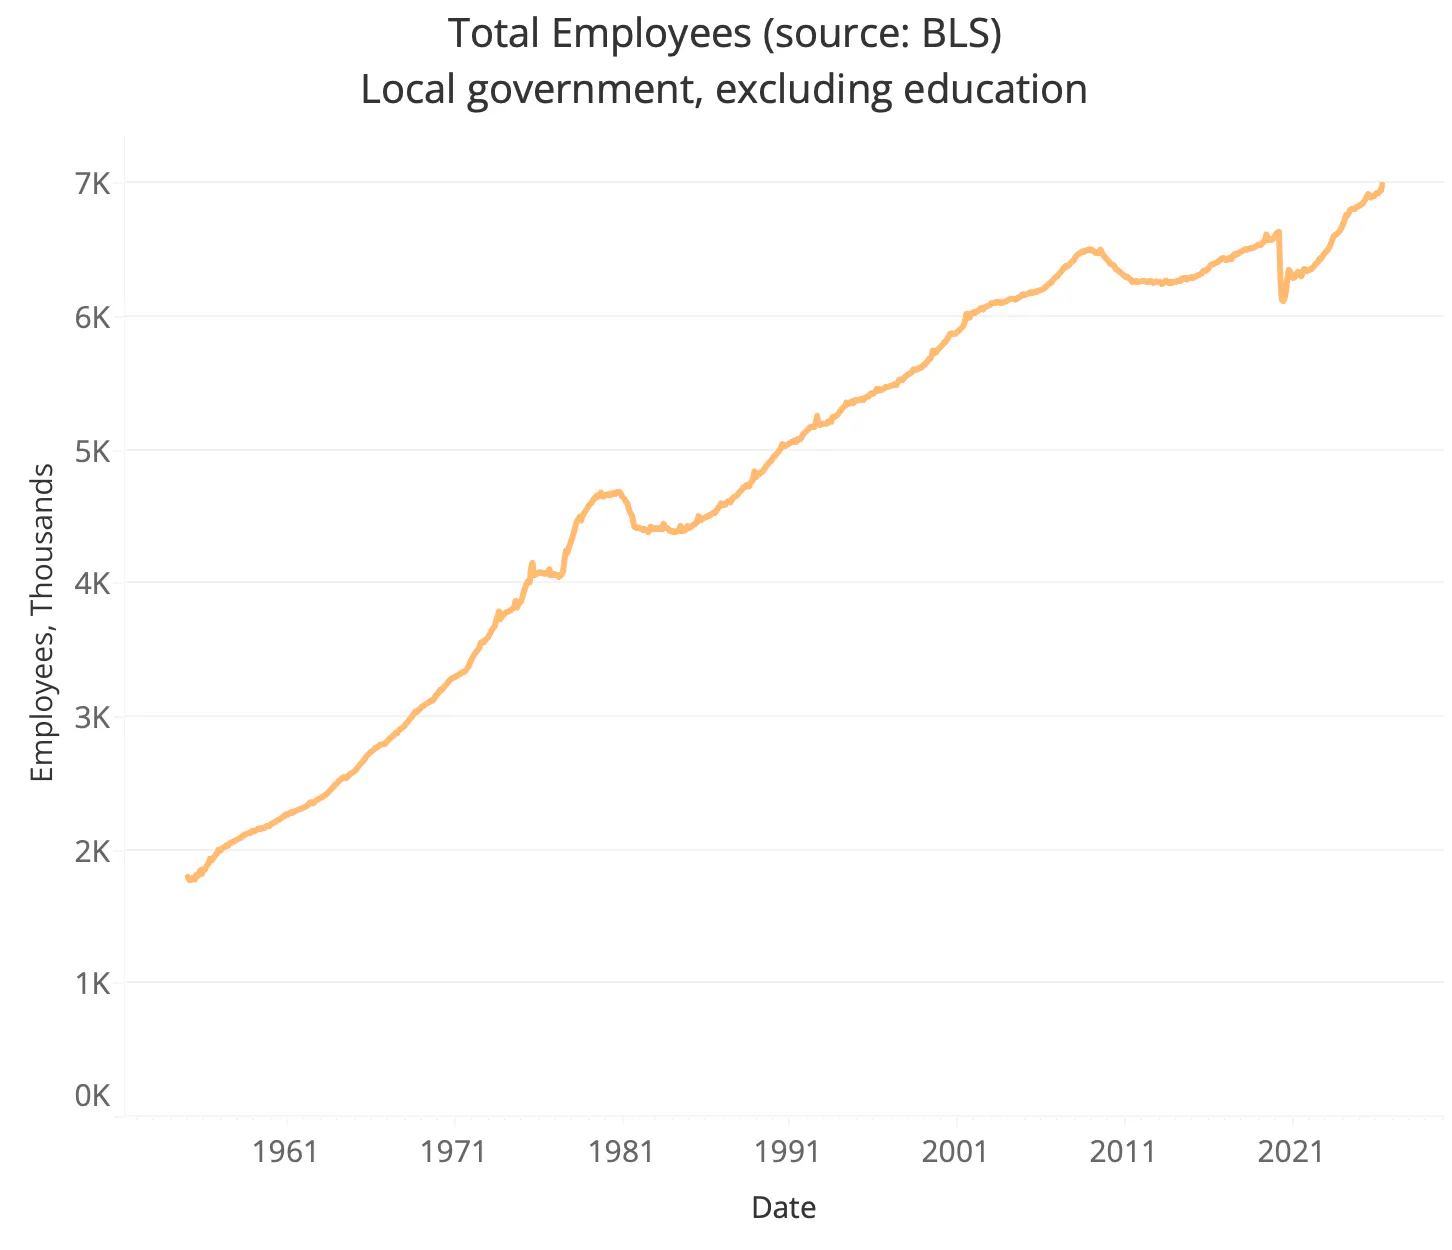
Most of this month's gain came from "local government, excluding education." We won't even venture a guess as to what's going on. But the chart is clear: local government ex-education is quietly in a structural growth phase. You won't find that narrative in the media - and yet, here's the data confirming it.
Healthcare and social assistance
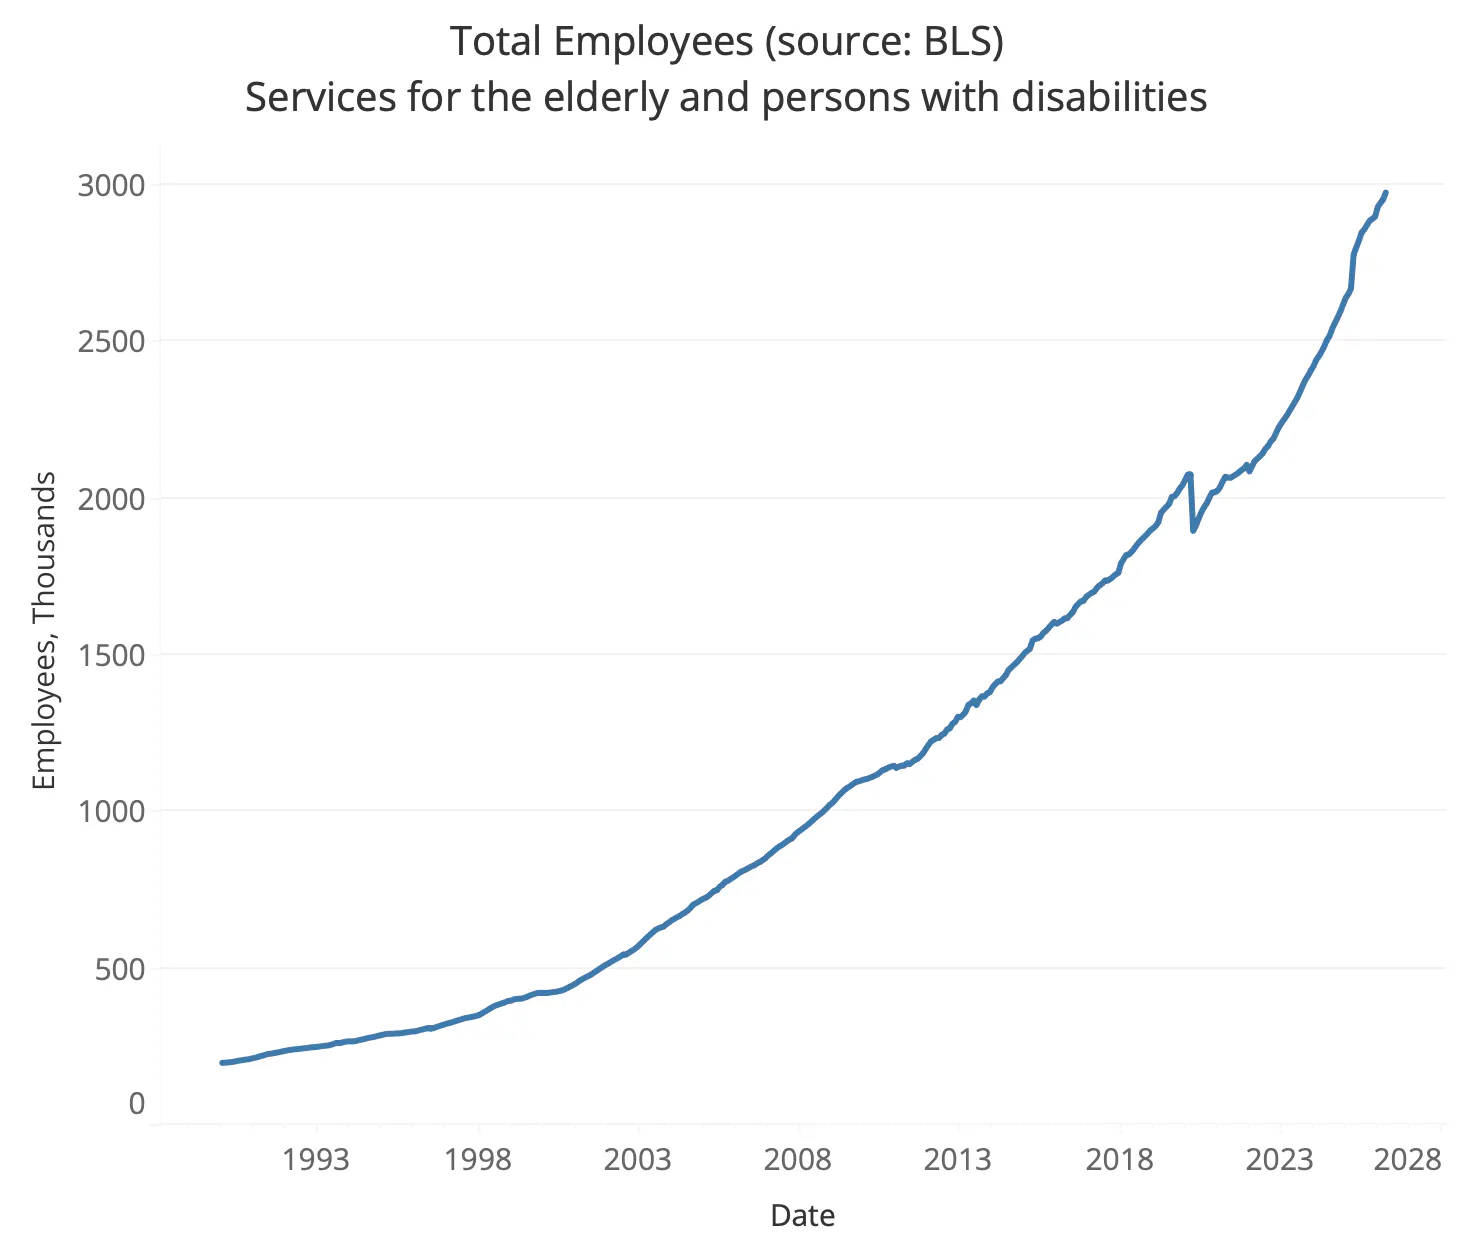
For loyal Bancreek readers, no need to rehash this one. Healthcare is structurally built to create jobs (for reasons we've written about at length), and in May it did exactly what it's designed to do. What's worth flagging is that with each passing month, healthcare and social assistance becomes more "social assistance" and less "healthcare." That's expected as America's hidden economy for caring for the elderly surges to meet a disproportionately growing senior population. It may be the most powerful structural tailwind in the entire job market.
But a word of caution: the latest data show home health aides pull in a median salary under $40,000 a year. These are very low-paying jobs - and food service falls in the same bucket. Keep that in mind as you weigh how "good" or "bad" these numbers really are for the real economy.
The bottom line
May gave us a solid headline and a healthy lower bound - even the worst-case read still has the economy adding jobs. But the texture matters more than the number. The growth is concentrated in a handful of industries, and the fastest-growing corner of the labor market is increasingly low-wage care work. So take the +172,000 for what it is: a strong month at the top line, with a quieter story underneath about what kind of jobs America is actually creating. Hold the point estimate lightly, watch the trends, and - as always - mind the range nobody else is looking at.
We hope this analysis has helped you look beyond the headline payroll number and better understand the underlying trends shaping today's labor market. As new employment data is released each month, Bancreek Capital Advisors will continue providing timely research and interactive tools to help put the numbers into context. Feel free to reach out to us with any questions or comments.
Enjoying this post?
Tell others about it.

Bancreek's Actively Managed ETFs
If you are interested in learning more about Bancreek Capital Advisors' actively managed ETFs click the link below
Learn MoreMore articles like this
Fetching Related Posts
There are no other articles tagged with Research
