
Key takeaways from the October 2024 Consumer Price Index release

Eric Pachman
Published
November 18th 2024
Eric Pachman
Published
November 18th 2024
October 2024 year-over-year inflation comes in 16 basis points higher than prior month
Last week the Bureau of Labor Statistics released the October 2024 Consumer Price Index for All Urban Consumers (CPI-U). Overall CPI-U was reported at 2.60% year-over-year (YoY) for October, up 16 basis points from 2.44% year-over-year last month.
As a reminder, Bancreek publishes two visualizations that can help you explore CPI-U in granular detail. Both of these visualizations have now been updated through October and are embedded below:
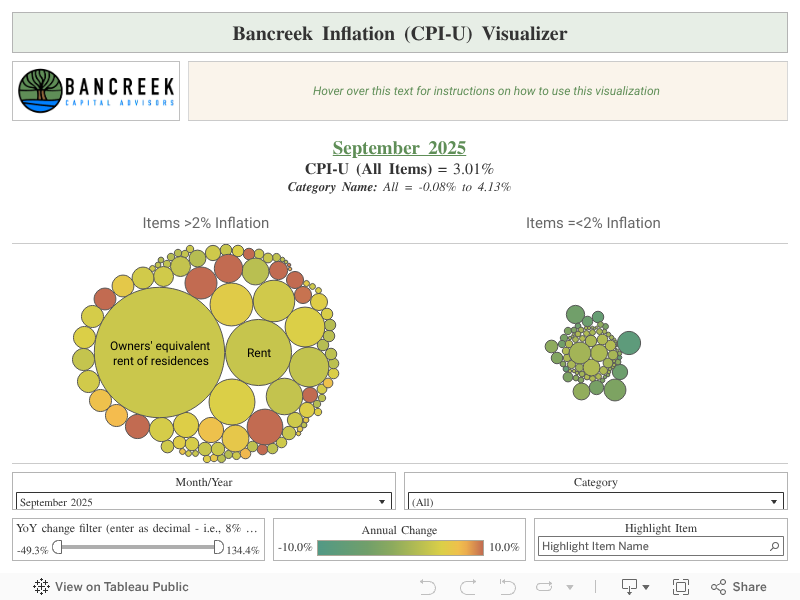
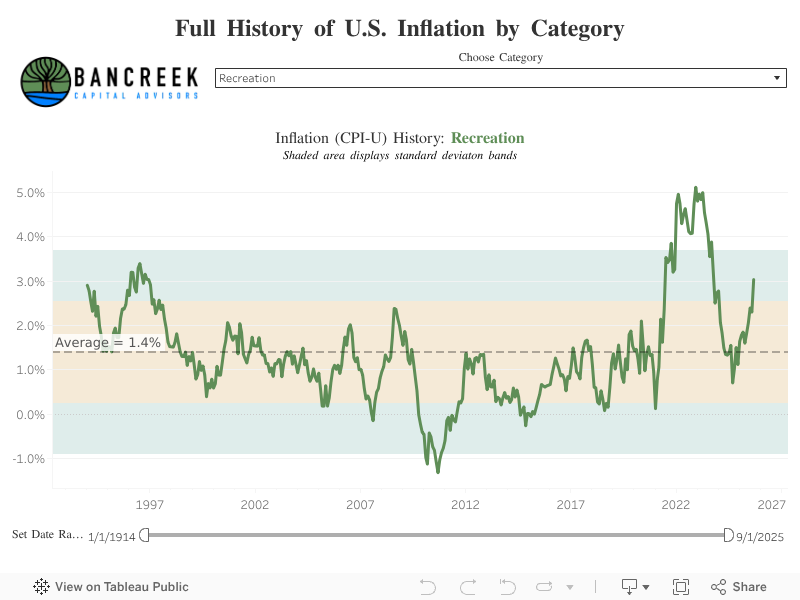
This post hopefully will further assist in your analysis of the moving parts underlying this month’s CPI-U print. Its goal is not to provide a comprehensive analysis of the nearly 180 items we track (that’s what the visualizations are for), but rather just to point to the most meaningful changes from one month to the next.
To perform this analysis, we track a measure we call “inflation impact,” which we calculate by multiplying each item’s YoY inflation by its weight in the prior year period. You can think of this as “weighted inflation” as opposed to the “unweighted inflation” that is more commonly reported by the media. Each month we take the weighted inflation of each item we track in CPI-U and then sum them up to overall CPI-U. Then we compare these weighted inflation numbers from one month to the next to see what drove the sequential increase or decrease. In this way, we can precisely identify the most significant drivers in the change in YoY CPI-U from one month to the next.
What changed in October?
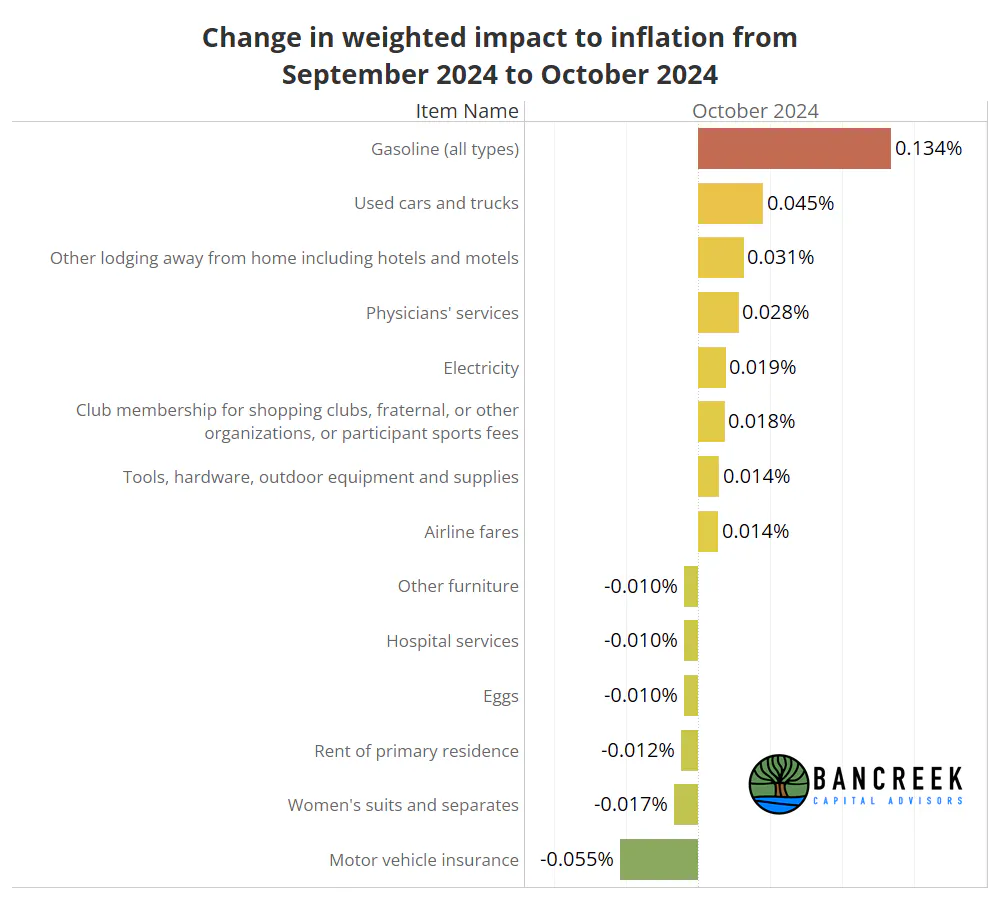
The nature of our monthly inflation analysis is a bit different from other analysis on this topic that you may find as you are surfing the web. What we are trying to do is help explain how we got from last month's CPI measurement (2.44%) to this month's inflation measurement (2.60%). In other words, what are the key items that drove the change from last month to this month? To do this, we calculate the inflation impact (again, "weighted" inflation) for all those granular items for the two months, and then subtract them. Then, we collect the items that moved the most from one month to the next and display them in the chart below for you:
Source: Bancreek Capital Advisors, LLC
Lower Gasoline deflation drives overall inflation higher in October
To help further explain the above chart let's focus on the first line item - Gasoline. Our analysis shows that the inflation impact of Gasoline increased by 13.4 basis points from September to October. Gasoline being a "bad guy" in October may be a bit confusing, as if you scroll up and look at our bubble chart visualization, you will find that the largest deflationary bubble on the right side of the tool is... Gasoline. But the analysis in this section is not trying to tell you the absolute inflation impact of each item. Rather, we are looking the change in each item. It just turns out that Gasoline was far more deflationary in September (-55.4 basis points) than it was in October (-42.0 basis points). The above chart takes the difference between those two absolute inflation impacts to arrive at the calculation that Gasoline increased YoY inflation from last month to this month by 13.4 basis points.
Lower Used cars and trucks deflation also drives overall inflation higher in October
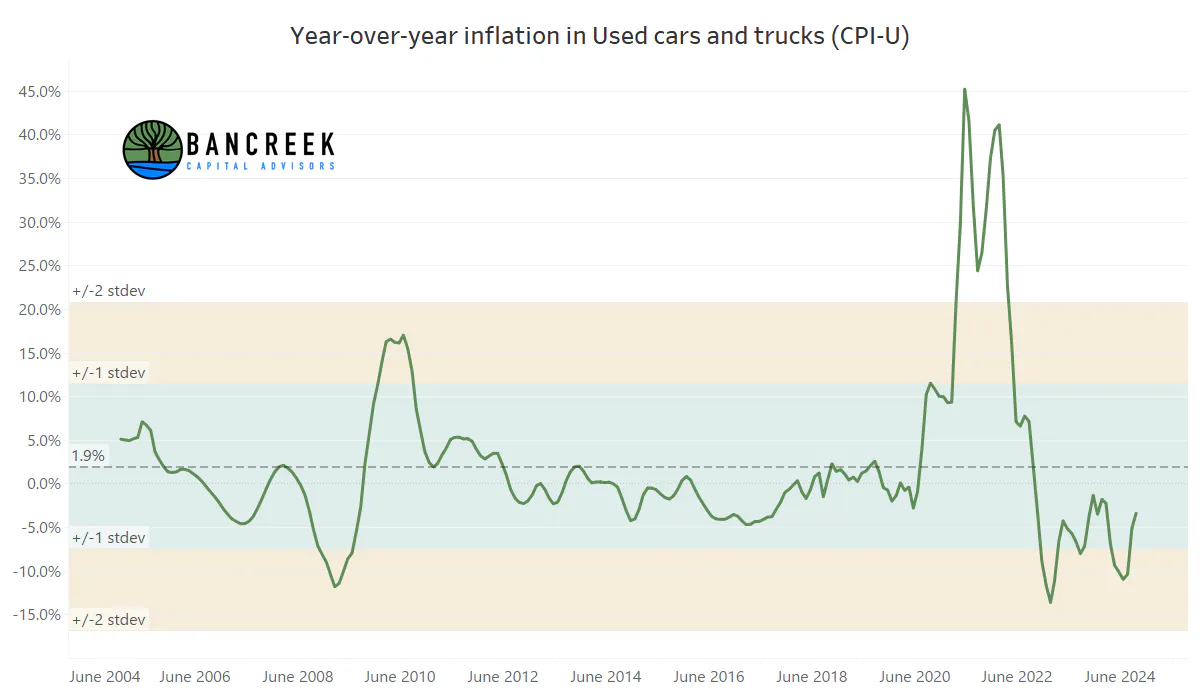
The second line item on the previous chart is also related to this dynamic of losing a deflationary benefit over time. As shown below, Used cars and trucks has been meaningfully deflating ever since its COVID-driven moonshot. But as of late, this deflation has been flattening out. In October it was down just -3.4% YoY, compared to down -5.1% in September. The weighted effect of this change added 4.5 basis points to headline CPI in the month.
Source: Bancreek Capital Advisors, LLC
Motor vehicle insurance finally cools!
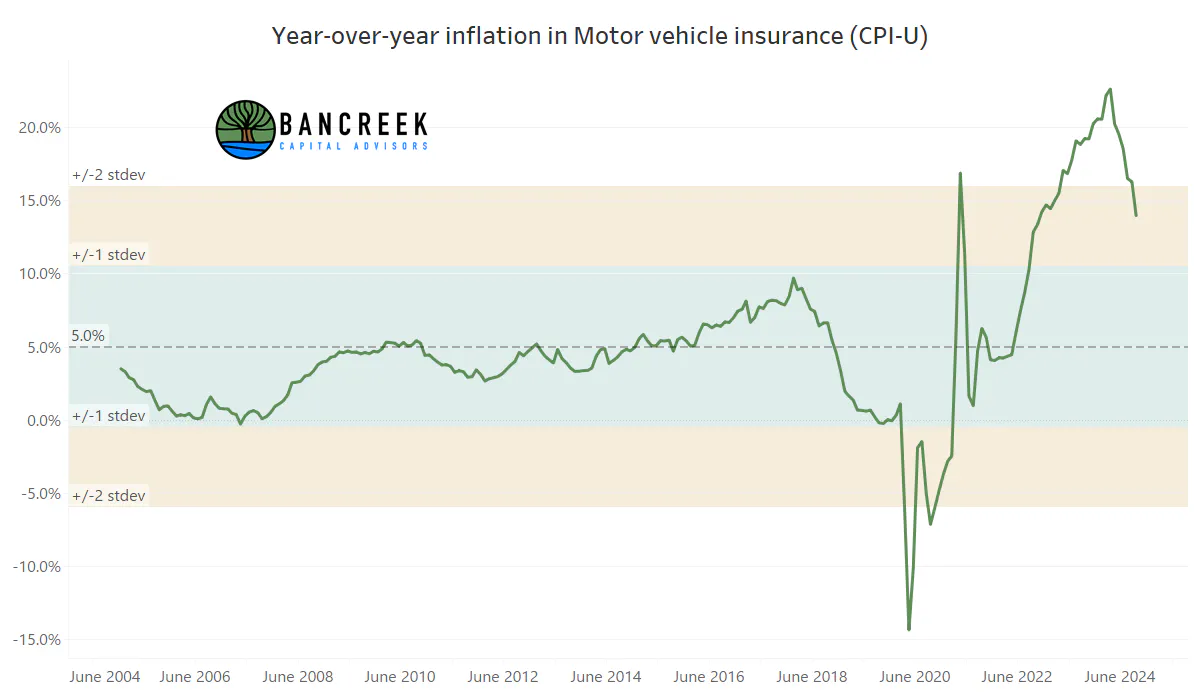
If you have been reading our work, you already are very familiar with our frustration with Motor vehicle insurance. If you are new to our work, just consider that if Motor vehicle insurance was inflating at normal historical levels, CPI would over the past year have been around 40 basis points lower than it was. Just to hammer this home, that means that if CPI was actually 2.8% in a given month, it should have been 2.4% in a "normal" auto insurance inflation scenario. 40 basis points is huge for any item not called shelter, and almost certainly has policy implications. The notion that some oddity in Motor vehicle insurance could have shifted the U.S. rate cycle, and then by extension, the entire global economy... well, is frustrating!
So, to that end, any signs that this madness is coming to an end are very welcomed by us. And we got one of these signs this month, with Motor vehicle insurance rising just 31 basis points month-over-month (MoM). This more subdued MoM inflation helped drag down YoY inflation to 14.0%, from 16.3% in September.
Source: Bancreek Capital Advisors, LLC
No real improvement in shelter
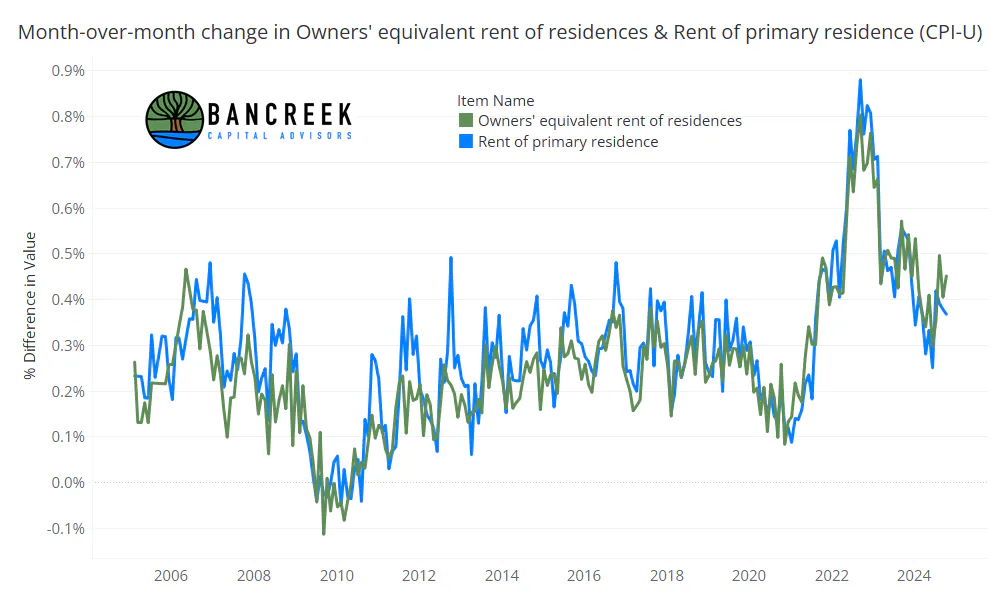
Given its oversize weight in CPI, no analysis of CPI would be complete without touching on the two key shelter components - Owners' equivalent rent of residences (OER) and Rent of primary residences (Rent). The below chart shows that MoM inflation for both of these items remain elevated. In fact, the run rate of OER's MoM inflation this month is 5.5% YoY. It's just so hard to gain any conviction in a 2% inflation world when nearly 26% of the measure is inflating at a 5.5% clip. This is not a forecast, or a view. It's just a statement based on math.
Source: Bancreek Capital Advisors, LLC
Where to from here? Updating our next six month CPI scenario analysis
Let's be honest, while we may feel a bit smarter understanding why things changed from one month to the next, from a market perspective, the inflation print is stale within a few minutes of it being released. The more interesting topic is what implications does the data released last week have on projections for future CPI? That's what we'll attempt to assist with this last section.
But before we go here, please read this disclaimer. The work we present here should not be interpreted to be a forecast. Rather, this is a scenario analysis given a very specific set of assumptions. All we do is plug the assumptions into our models, and report the output to you. Note that we give a brief overview of the scenarios below. If you are looking for more context on how we arrived at the assumptions underlying these three scenarios we would strongly recommend reading last month's "Homes vs. Autos" piece in which we extensively analyze each of the major items driving recent inflation.
To be sure, this exercise is not all that helpful in an era of heightened pricing volatility, as it largely assumes that inflation for modeled items remain on a similar trajectory to where they have recently been. Thankfully, that's the environment we have been in for many months now, making these scenarios more useful. But if inflation resurges thanks to disruption of the labor force by mass deportations, or higher prices due to heightened protectionism, or war in the Middle East, or (god-forbid) another pandemic, or any other unforeseen shock to the global economy, well you can throw this scenario analysis in the trash along with all the other forecasts you are using.
That said, here are the assumptions and resulting next six month CPI scenario analysis:
Low inflation scenario
- OER and Rents rise by 30 basis points MoM each month
- Used cars and trucks declines by -10 basis points MoM each month
- Motor vehicle insurance rises by 42 basis points (its historical average) MoM each month
- Gasoline declines by -2.1% MoM in November to get to the current November average as of 11/17, and then rises by its historical average (+47 basis points MoM) each month in December forward
- All other items net to 1% weighted inflation (the level at which they have been hovering for the last eight months)
Medium inflation scenario
- OER and Rents rise by 40 basis points MoM each month
- Used cars and trucks rises by 12 basis points MoM each month (its historical average)
- Motor vehicle insurance rises by 75 basis points MoM each month
- Gasoline declines by -2.1% MoM in November to get to the current November average as of 11/17, and then rises by its historical average (+47 basis points MoM) each month in December forward
- All other items net to 1% weighted inflation (the level at which they have been hovering for the last eight months)
High inflation scenario
- OER and Rents rise by 50 basis points MoM each month
- Used cars and trucks rises by 30 basis points MoM each month
- Motor vehicle insurance rises by 100 basis points MoM each month
- Gasoline declines by -2.1% MoM in November to get to the current November average as of 11/17, and then rises by its historical average (+47 basis points MoM) each month in December forward
- All other items net to 1% weighted inflation (the level at which they have been hovering for the last eight months)
CPI path of least resistance is up, before heading down again
When we plug the three aforementioned scenarios into our model, we get the following outlook for the next six months. Our takeaway is that the path of least resistance, even in a very optimistic outlook, is for inflation to head up from here. How much it goes up will likely depend on the upcoming prints from the handful of heavy hitter items we flexed in this scenario analysis. Then, after January 2025, CPI looks like it should start to ease again as comparisons get easier for these highly influential items. But we should note that our confidence in this outlook drops considerably as we look further out. A lot could change in the next three months, rendering the early 2025 downward trend we see now a moot point. But there is much less that can disrupt the upward swing we appear to be on in the coming few months.

Source: Bancreek Capital Advisors, LLC
We hope that this post has been useful in understanding the key drivers of inflation this month, and more importantly, going forward, and getting a better feel of the magnitude of an impact they could have. Feel free to reach out to us with any questions or comments.
Enjoying this post?
Tell others about it.

Bancreek's Actively Managed ETFs
If you are interested in learning more about Bancreek Capital Advisors' actively managed ETFs click the link below
Learn MoreMore articles like this
Fetching Related Posts
There are no other articles tagged with Research
